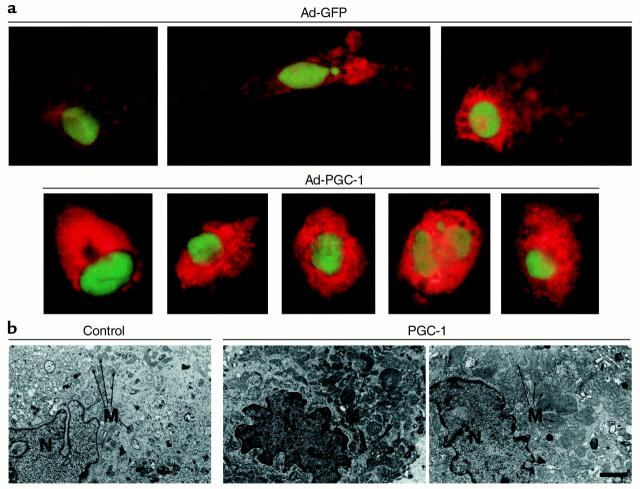
Figure 4.
PGC-1 promotes mitochondrial biogenesis in cardiac myocytes. (a) Fluorescence micrograph panels representing the use of the mitochondrion-selective dye MitoTracker to estimate mitochondrial capacity in cardiac myocytes 5 days after infection with either a GFP-expressing control adenovirus (Ad-GFP) or an adenovirus expressing both GFP and PGC-1 (Ad-PGC-1). MitoTracker, which is oxidized, sequestered, and conjugated in mitochondria, is identified by the orange-red color. GFP, which confirms adenoviral infection, is seen as a nuclear-localized green color. (b) Electron micrographs obtained from sections of cultured rat neonatal cardiac myocyte pellets representing cells infected with either Ad-GFP (Control) or Ad-PGC-1 (PGC-1). The far right panel is representative of regions containing markedly enlarged mitochondria observed in the PGC-1–expressing myocytes. Bar represents 1 μm, the size standard for all three panels. M, mitochondria; N, nucleus.

