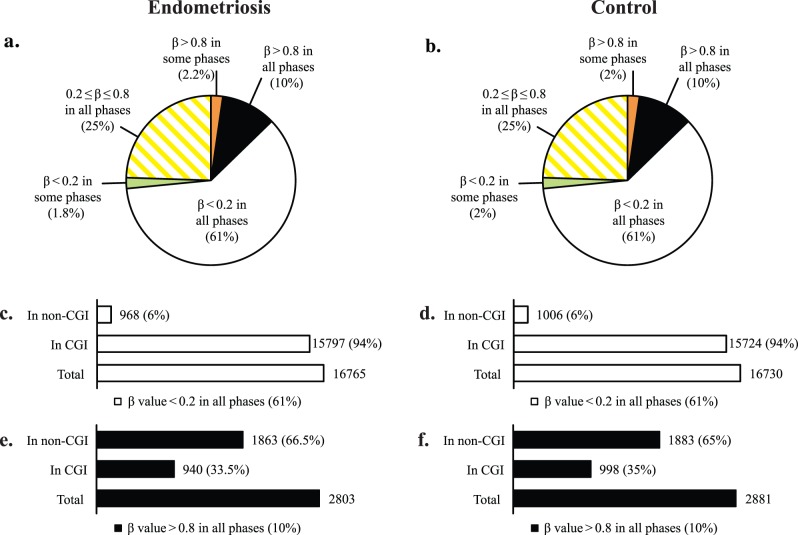
FIG. 1.
Global DNA methylation pattern of eutopic endometrium in endometriosis and its comparison with normal eutopic endometrium based on both methylation levels and CpG site location within or outside CpG islands. a and b) Pie charts depict global distribution of methylation levels in eutopic endometrium of endometriosis (a), and control (b). In endometriosis (similar to control) most (61%; white section) of the platform's interrogated CpG sites are hypomethylated (β-value < 0.2) in all cycle phases, a small percentage (10%; black section) of the platform's CpG sites are hypermethylated (β-value > 0.8) in all cycle phases, about 25% (hatched yellow) have intermediate levels of methylation (0.2 ≤ β-value ≤ 0.8), and 1.8% (green section) are hypomethylated and 2.2% are hypermethylated (orange section) in some but not all phases (2% and 2% in control, respectively). c and d) Distribution of CGIs within the hypomethylated group in endometriosis and control endometrium, respectively: Most of the platform's CpG sites that are hypomethylated (61%; white) consist of nearly all (94%) CGIs, with only 6% non-CGI CpG sites. e and f) Distribution of CGIs within the hypermethylated group in endometriosis and control endometrium: the hypermethylated group in disease consists of 2803 CpG sites (10% of the platform's CpGs), but they are mostly non-CGIs (66.5%), with only 33.5% hypermethylated CGIs, comparable to control.

