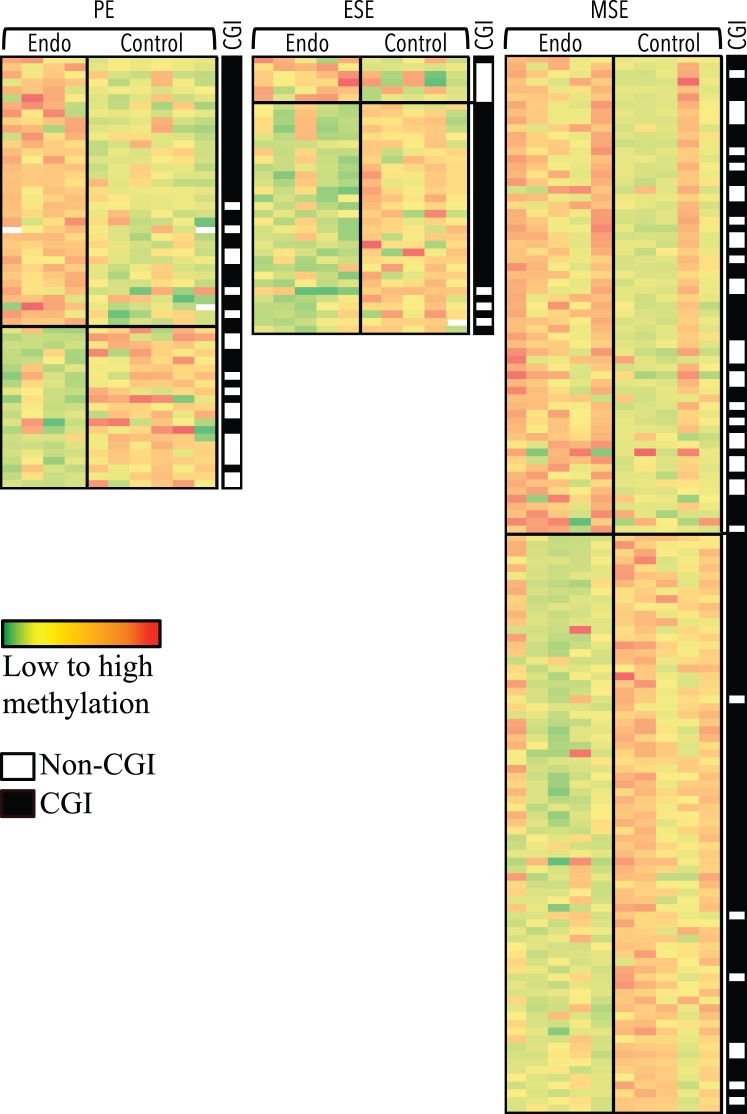
FIG. 2.
CpG sites differentially methylated by phase in disease versus control eutopic endometrium. Columns represent samples. Rows represent CpG sites. Green to red: low to high methylation. Largest differences between phases of disease (Endo) and control is observed in MSE, followed by PE and ESE. Top section of each heat map represents loci more methylated in disease versus control, and bottom section represents loci less methylated in disease versus control. Location within or outside CGIs for each locus, in each heat map is depicted in the black/white CGI column, with black representing within CGI and white representing outside CGI. Loci in each comparison heat map are unique.

