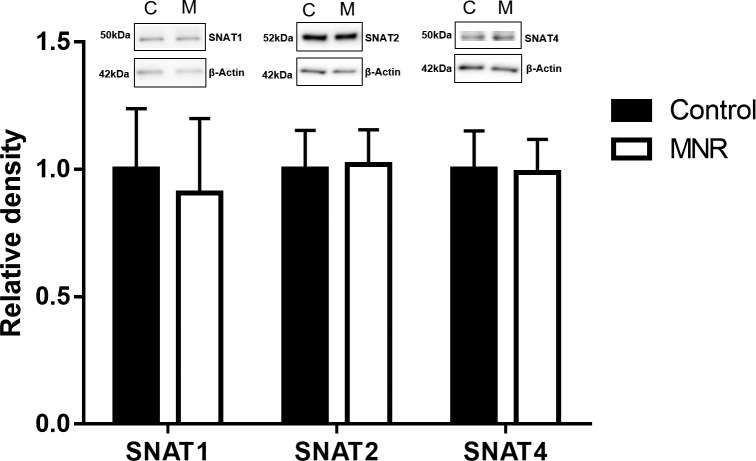
FIG. 3.
Protein expression of amino acid system A transporter isoforms SNAT1, SNAT2, and SNAT4 in MVM isolated from control (C) and MNR (M) baboons at GD 120. Histogram summarizing Western blot analysis data. Equal loading was performed. After normalization to β-actin, the mean density of C samples was assigned an arbitrary value of 1. Values given as mean ± SEM. *P < 0.05, unpaired Student t-test (n = 8 control; n = 9 MNR).

