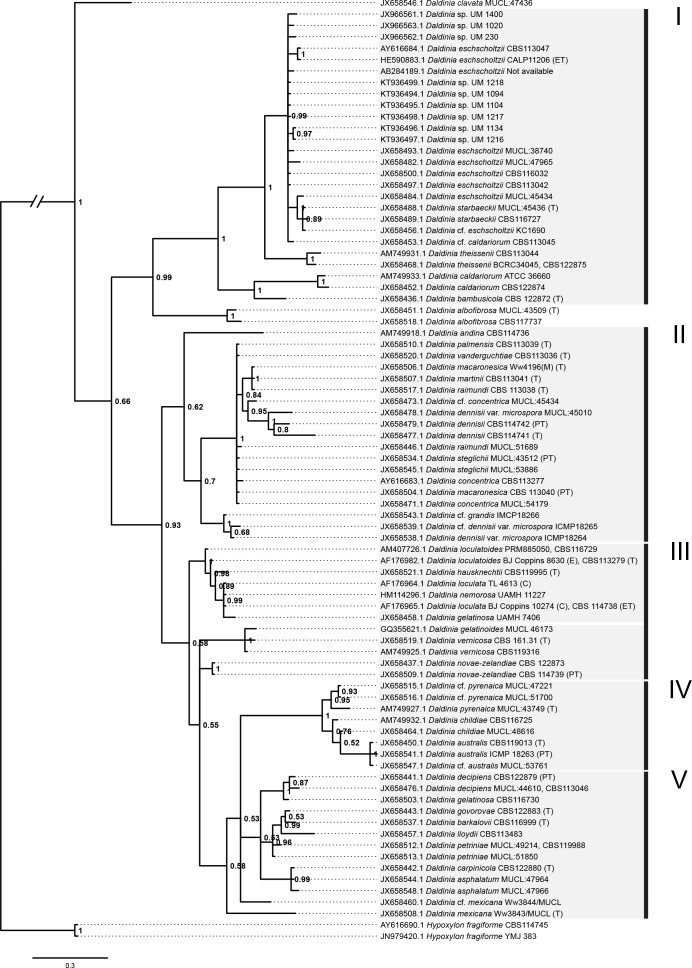
Figure 5. Bayesian phylogram generated using the ITS sequence data.
The tree was rooted with two Hypoxylon fragiforme sequences as outgroups. UM 1400, UM 2010, UM 230, UM 1094, UM 1104, UM 1134, UM 1216, UM 1217, and UM 1218 isolates were clustered in Group I. Numbers on the nodes indicate Bayesian posterior probability based on 100 sampling frequency for a total of 15,000,000 generations.

