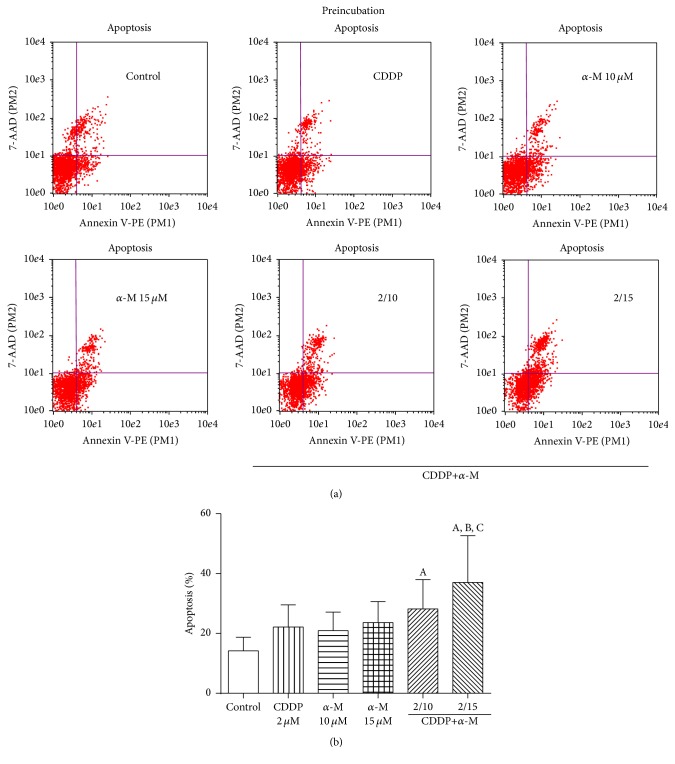
Figure 5.
(a) Dot blots representative of the preincubation scheme. (b) Flow cytometry analysis of the percentage of apoptosis with the preincubation scheme in the control, CDDP, α-M, and combined treatment groups. Each bar represents the mean ± SD of four independent experiments. A versus control group; B versus CDDP group; C versus α-M 15 μM group; p ≤ 0.05.

