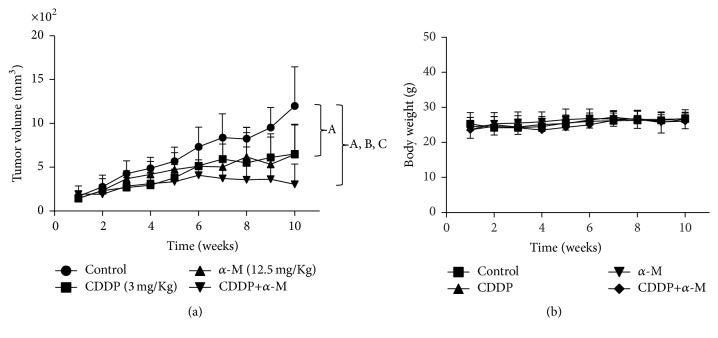
Figure 6.
(a) Time course of tumor volume growth in mice after a subcutaneous implant of HeLa cells that were treated with the vehicle (control), CDDP, α-M, and CDDP+α-M. (b) Body weight, measured once per week, of mice treated with the vehicle, CDDP, α-M, and CDDP+α-M. Each bar represents the mean ± SD of six to eight animals. A versus control group; B versus CDDP group; C versus α-M group; p ≤ 0.05.

