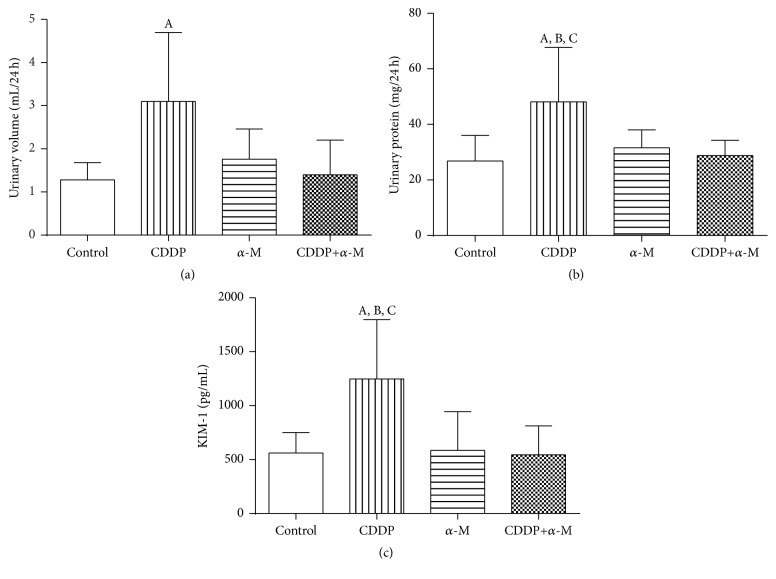
Figure 7.
Markers of nephrotoxicity for all groups. (a) Urinary volume. (b) Urinary protein. (c) Kidney injury molecule 1 (KIM-1). CDDP: cisplatin; α-M: alpha mangostin. Each bar represents the mean ± SD of six to eight animals. A versus control group; B versus α-M group; C versus CDDP+α-M group; p ≤ 0.05.

