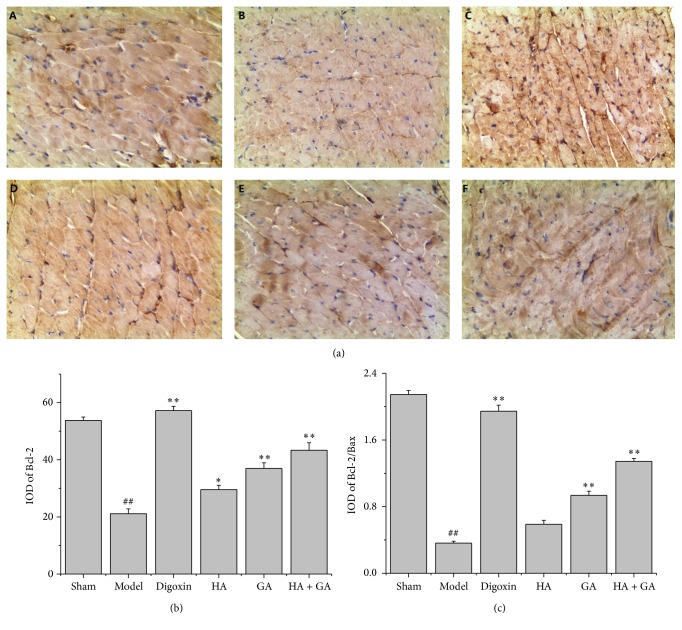
Figure 5.
(a) Immunostaining microphotographs of Bcl-2 (magnification 200x). (b) Quantitative image analyses of Bcl-2 protein were performed based on the IOD of positive immunostaining (brown) in the heart tissues. (c) The ratio of Bcl-2/Bax in IOD. All data were presented as mean ± SD. ## P < 0.01 versus Sham group; ∗ P < 0.05 and ∗∗ P < 0.01 versus Model group. A: Sham group (n = 6), B: Model group (n = 6), C: Digoxin group (n = 6), D: HA group (n = 6), E: GA group (n = 7), and F: HA + GA group (n = 7). HA: hypaconitine; GA: glycyrrhetinic acid.

