
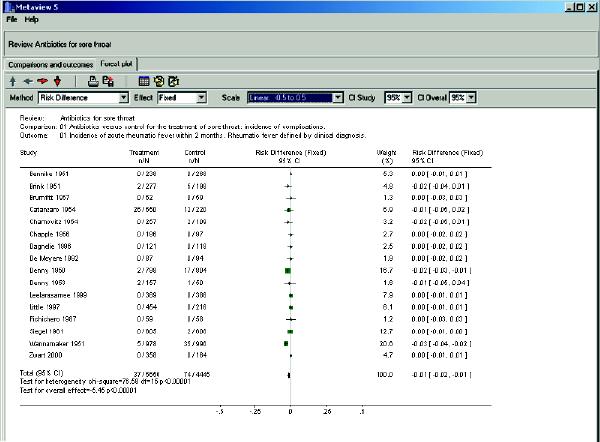
Fig. 3: Forest plot of the outcome “Incidence of acute rheumatic fever within 2 months”1 with risk difference as the statistic. Same comparison and outcome as in Fig. 2, but in the “Method box” the statistical test has been changed to “risk difference,” and the scale has been changed to “–0.5 to 0.5” to make it easier to visualize the results of individual studies. The vertical line under the heading “Risk difference (fixed)” represents no difference in outcomes between the treatment and control groups (unity is now 0). All studies have now been assigned a weight. The risk difference is –0.01 (95% CI –0.02 to –0.01), p < 0.0001. The test for heterogeneity is statistically significant (p < 0.0001), which indicates that there is study heterogeneity with regard to the effect size.