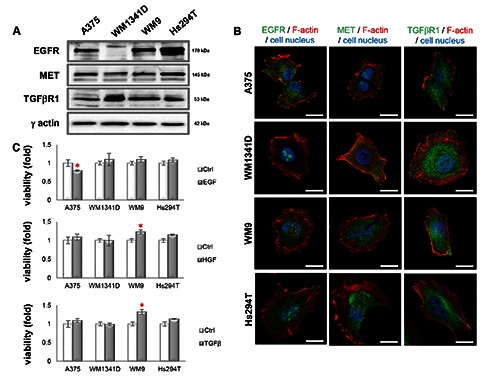
Figure 2.

Expression level and subcellular localization of EGFR, MET and TGFβR1 in melanoma cell lines and effects of EGF, HGF or TGFβ on melanoma cell lines’ viability. A) Western blot analysis of EGFR, MET and TGFβR1 levels in cell lysates. The blots were probed with rabbit anti-EGFR, anti-MET or anti-TGFβR1 antibodies. Visualization of γ-actin served as a loading control; 30 μg of protein was loaded on every lane. B) Immunostaining was performed on cells with antibodies directed against EGFR, MET or TGFβR1. The cells were counterstained with Alexa Fluor 568-labeled phalloidin and Hoechst 33342. Scale bar: 20 μm. C) Viability of cells treated with SMs was compared to viability of non-treated control cells. Results expressed as the mean ±SD are representative for at least three independent experiments. Statistical significance was determined in two-tailed, unpaired Student’s t-test. Significance levels were set at P≤0.05 (one asterisk).
