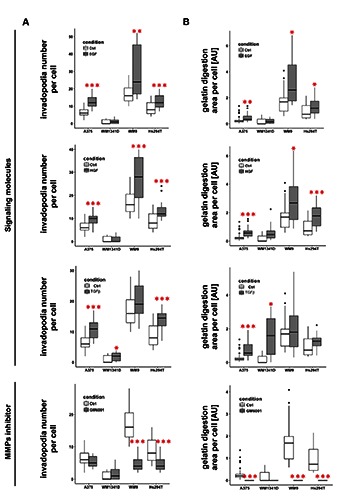
Figure 5.

Quantitative analysis of effects of EGF, HGF or TGFβ on melanoma cell lines’ invadopodia formation and extracellular matrix degradation potential. A-B: Upon capture of the images (Figure 4) number of invadopodia (A) and the size of digested area (B) were calculated using ImageJ software. Thirty cells were analyzed for each condition. Boxes show the median values of RQ±interquartile range. Statistical significance was determined in two-tailed, unpaired Student’s t-test. Significance levels were set at P≤0.05 (one asterisk), P≤0.01 (two asterisks) and P≤0.001 (three asterisks).
