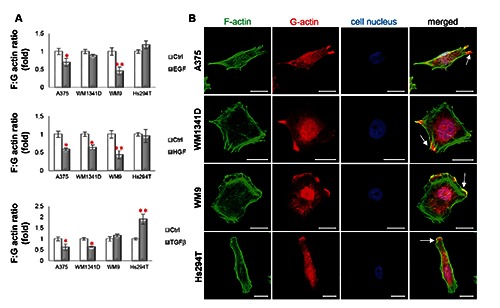
Figure 6.

Actin polymerization state in melanoma cells is affected by SMs. A) F:G ratio of control cells is presented as 1. B) Confocal microscopy analysis was performed on cells, which were stained with Alexa Fluor 488-labeled phalloidin, Alexa Fluor 594-labeled DNase I and Hoechst 33342 to visualize F-actin, G-actin and nuclei. White arrows indicate the lamellipodia rich in F- and G-actin. Scale bar: 20 μm.
