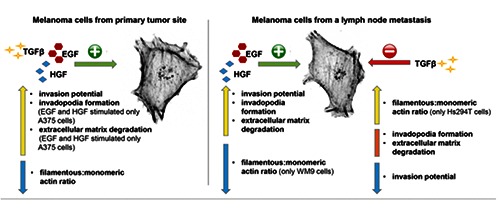
Figure 7.

Schematic representation of effects caused by EGF, HGF and TGFβ on melanoma cells isolated from primary tumor site (A375 and WM1341D) and from a lymph node metastasis (WM9 and Hs294T). A yellow arrow represents a rise, a orange bar reflects unchanged values and a blue arrow represents a decrease.
