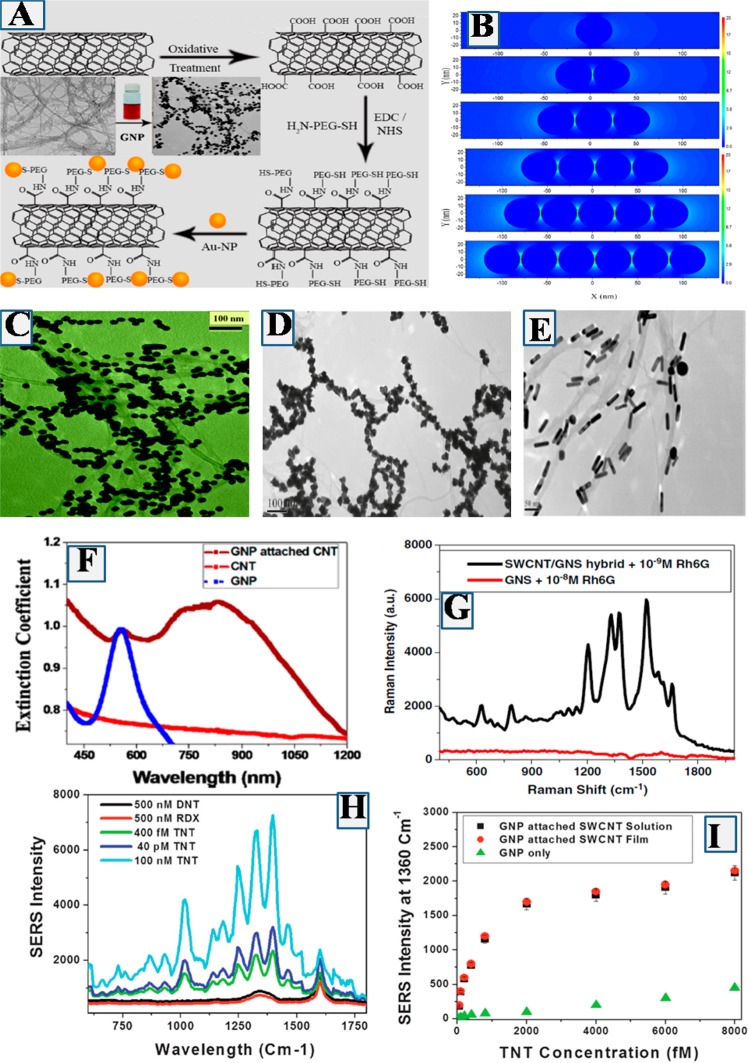
Figure 3.
(A) Synthetic path for the development of plasmonic nanoparticle attached hybrid CNT. (B) FDTD simulated data show the electric field enhancement profiles for 40 nm gold nanoparticle assembly structure. (C) TEM image shows plasmonic spherical gold nanoparticles are attached on SWCNT and formed large number of “hot spots” on CNT (Reproduced with permission from ref (37). Copyright 2015 American Chemical Society). (D) TEM image shows plasmonic popcorn shape gold nanoparticles are attached on SWCNT via the formation of “hot spots” (reproduced with permission from ref (39). Copyright 2011 American Chemical Society). (E) TEM image showing plasmonic rod shaped gold nanoparticles are attached on SWCNT via the formation of “hot spot” (Reproduced with permission from ref (42). Copyright 2011 Elsevier). (F) Extinction spectra for GNP, GNP attached SWCNT, and only SWCNT (Reproduced with permission from ref (37). Copyright 2015 American Chemical Society). (G) Raman intensity from Rh6G on nanoparticle and nanoparticle attached SWCNT. (H) Raman intensity from TNT on popcorn shape nanoparticle and nanoparticle attached SWCNT. (I) TNT Raman intensity enhancement on nanoparticle and nanoparticle attached SWCNT (Reproduced with permission from ref (41). Copyright 2012 Royal Society of Chemistry).

