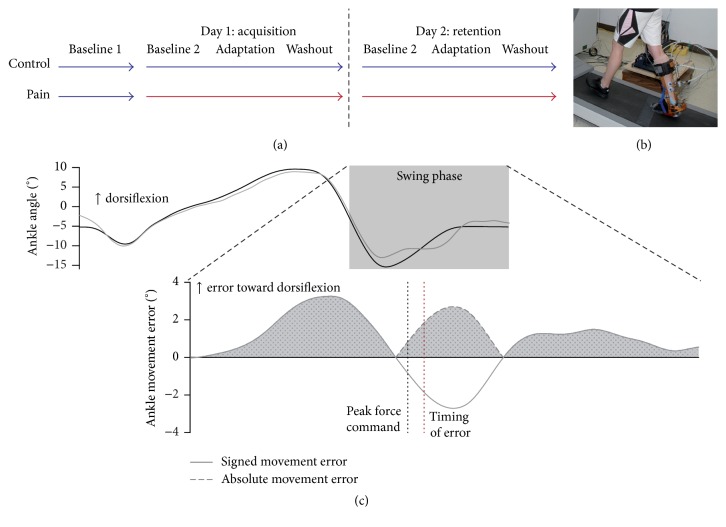
Figure 1.
(a) General protocol of the experiment: blue and red arrows illustrate phases of the experiment performed without and with pain, respectively. (b) Robotized ankle-foot orthosis (rAFO). (c) Ankle kinematics outcome measures: the upper panel presents ankle angle during baseline gait (black) and adaptation (gray) for the whole stride duration. The lower panel illustrates the signed and absolute ankle movement error during the swing phase. The gray shaded area illustrates the mean absolute error outcome measure. The black and red dotted lines show the peak force command and the timing of movement error, respectively.

