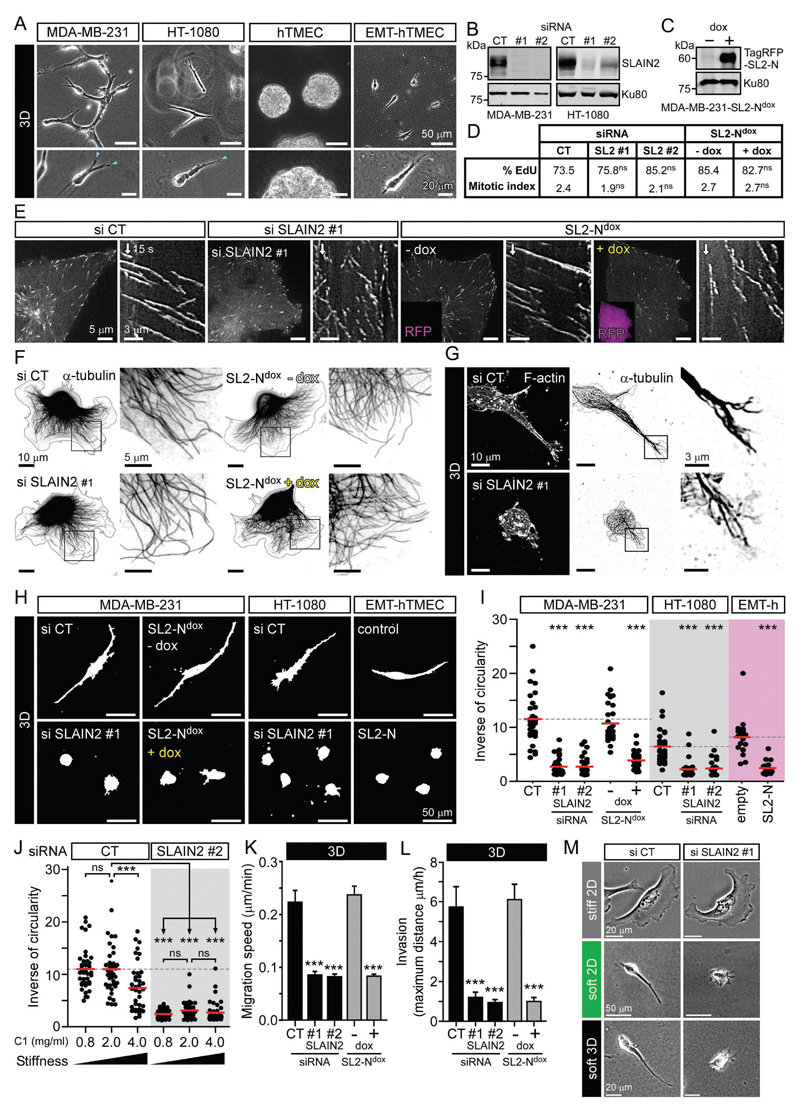
Figure 1. SLAIN2 is required for mesenchymal cell invasion.
A. Morphology of cancer and non-cancer mesenchymal cells grown in collagen I-based 3D matrices: MDA-MB-231, HT-1080 and untransformed human mammary epithelial cells converted to mesenchymal cells by EMT (EMT-hTMEC, 4 days in 3D, compared to control cells hTMEC, 16 days in 3D); blue arrowheads, invasive pseudopods at the leading edge.
B, C. Western blot analysis of SLAIN2 depletion by two independent siRNAs (#1 and #2) compared to control siRNA (CT) in MDA-MB-231 and HT-1080 cells (B), and doxycycline-induced expression (dox) of the TagRFP-T-tagged dominant negative SLAIN2 mutant (SL2-N) in MDA-MB-231 cells (MDA-MB-231-SL2-Ndox) (C).
D. S-phase progression and cell division assessed by 5-ethynyl-2'-deoxyuridine (EdU) incorporation, expressed in percentage, and mitotic index in MDA-MB-231 cells treated as in (B) and (C).
E. Changes in MT dynamics in MDA-MB-231 cells treated as in (B) and (C) and illustrated by live fluorescence images and kymographs of EB3-GFP.
F, G. MT network in 2D- and 3D-grown MDA-MB-231 cells treated as in (B) and (C); immunofluorescence staining of α-tubulin and cell outline (grey line).
H, I. Effect of SLAIN2 inactivation on invasive cell morphology of 3D-grown cells (H) and corresponding quantification of cell elongation (I); EMT-hTMECs were transduced with the empty vector or TagRFP-T-tagged dominant negative SLAIN2-N.
J. Quantification of SLAIN2-depleted MDA-MB-231 cell elongation in collagen I (C1) gels of different concentrations.
K, L. Migration speed (K) and maximum invasion distance (L) of 3D-cultured cells treated as in (B) and (C).
M. Comparison of cell morphology on 2D stiff matrix (collagen I-coated glass), on top of 2D soft matrix (2 mg/ml collagen I gel) or inside 3D soft matrix (2 mg/ml collagen I gel) using phase contrast imaging.
Bar plots are presented as mean ±SEM. Red line, mean. In all plots, ns, no significant difference with control; ***, P<0.001, Mann-Whitney U test.
See also Figure S1 and S2, and Movies S1 and S2.

