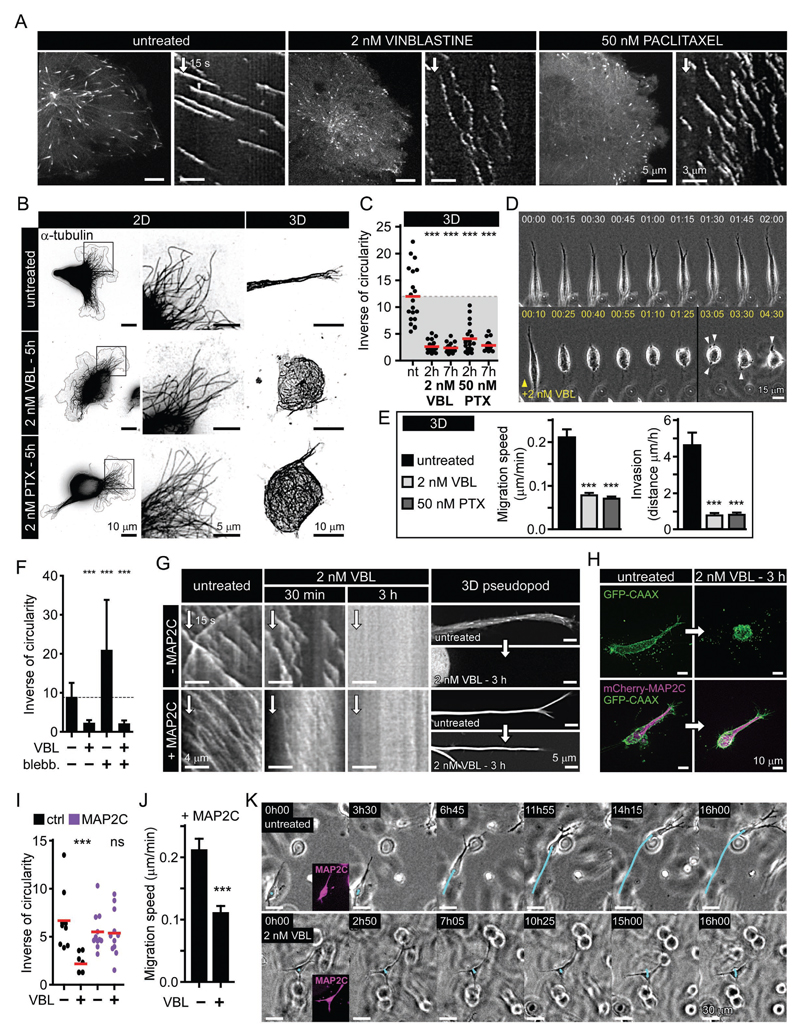
Figure 6. Inhibition of MT depolymerization is sufficient for invasive pseudopod maintenance.
A. Catastrophe induction by low doses of vinblastine (VBL) and paclitaxel (PTX) illustrated by live fluorescence images and kymographs of EB3-GFP in MDA-MB-231 cells.
B. MT network maintenance in 2D- and 3D-grown cells treated as in (A), illustrated by immunofluorescence staining of α-tubulin.
C. Quantification of invasive morphology of 3D-grown cells treated as in (A).
D. Phase contrast images from time-lapse recording of mesenchymal cells migrating in a 3D matrix and treated when indicated by vinblastine as in (A). Arrowheads indicate the formation of small pseudopods that fail to elongate.
E. Migration speed and invasion of mesenchymal cells grown in 3D and treated as in (A).
F. Effect of myosin II inhibition (blebb., blebbistatin) on invasive morphology of cells treated as in (A).
G. Effect of MAP2C expression on the maintenance of invasive pseudopods when MT growth persistence is attenuated. Kymographs show EB3-GFP dynamics in cells treated as indicated, and panels on the right show invasive pseudopods before and after treatment; in +MAP2C condition, images are mCherry-MAP2C fluorescence.
H, I. Invasive morphology (H) and its quantification (I) in 3D-grown mesenchymal cells before and after attenuation of persistent MT growth by vinblastine as in (A), with or without MAP2C expression.
J, K. 3D migration speed (J) and invasive behavior (K) of MAP2C-expressing cells treated as in (A). Bar plots are presented as mean ±SEM. Red line, mean. In all plots: ns, no significant difference with control; ***, P<0.001, Mann-Whitney U test.

