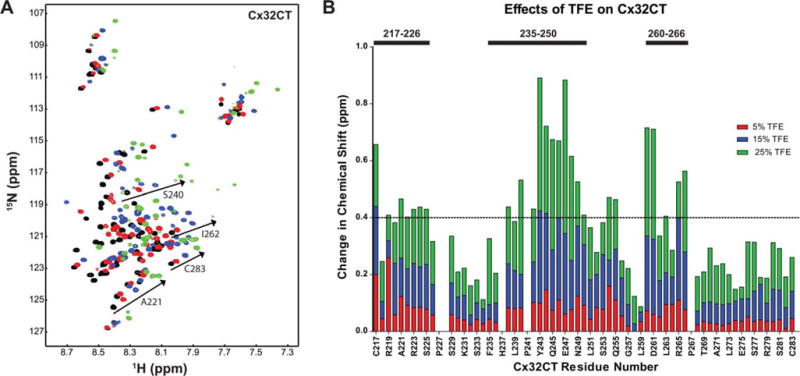
FIGURE 4.

Identification of Cx32CT regions that have α-helical propensity. (A) NMR control spectrum, Cx32CT-only (black), has been overlapped with spectra obtained when the Cx32CT was in the presence of 5% (red), 15% (blue), and 25% (green) 2,2,2-trifluoroethanol (TFE). Spectra for the Cx32CT in the presence of 10%, 20%, and 30% TFE were also collected but not shown due to peak overlap. (B) From (A), each residue was plotted against their change in chemical shift (Δσ = √((ΔδHN)2 + (ΔδN/5))2) as a function of TFE concentration. The three regions that form α-helical structure in the presence of TFE are indicated with bars. The horizontal line indicates the chemical shift change cut-off at 0.4 ppm.
