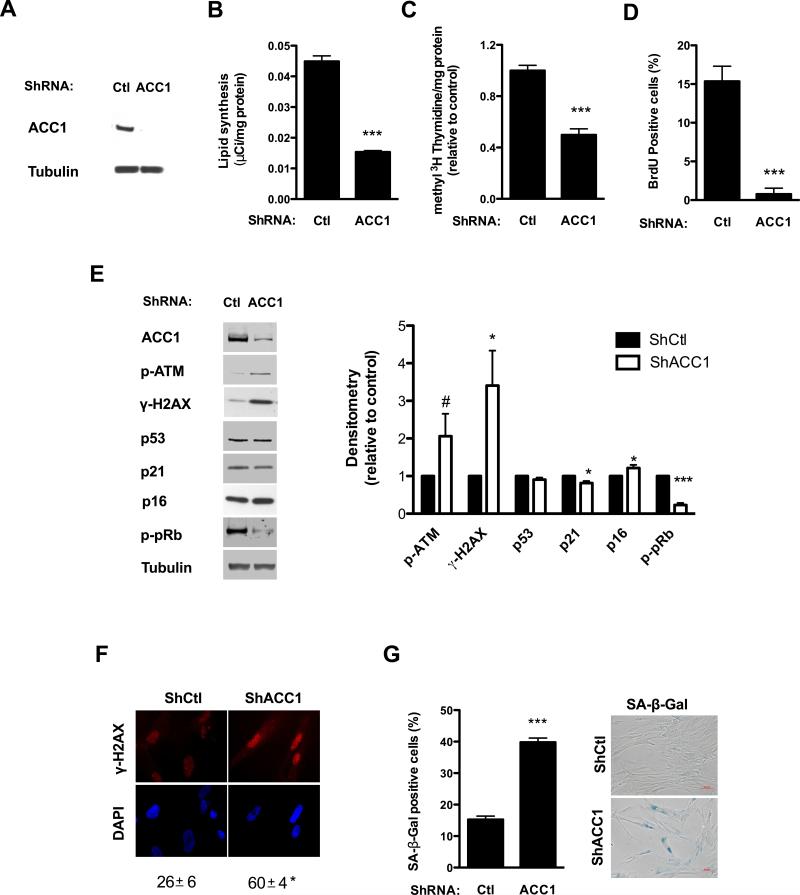
Figure 4. Knockdown of ACC1 inhibits cell proliferation and induces senescence in human fibroblasts.
Early passage human fibroblasts were transduced with lentiviral particles containing either a control or ACC1 specific shRNA and subsequently selected with puromycin; assays were performed four to six days after transduction. (A) ACC1 protein levels were assessed by Western blot and (B) lipid synthesis was determined by 14C-acetate incorporation. (C and D) Cell proliferation was measured as [methyl 3H]-thymidine incorporation to DNA per mg of cell protein and expressed relative to control values (C); or measuring BrdU incorporation to DNA (D). (E) ATM phosphorylation (p-ATM), p53, p21, p16 and pRb phosphorylation (p-pRB) were assessed by Western blot; tubulin was used as loading control. The graph on the right shows the protein levels of the different markers, normalized by the loading control and expressed relative to control cells. (F) γ-H2AX foci were evaluated by immunofluorescence, original magnification X400. The percentage of cells with positive nuclear foci is shown below the picture. (G) The percentage of cells with positive SA-β-Gal staining was determined by light microscopy. Representative pictures are shown on the right, original magnification X100. Results are expressed as the mean ± SEM (n≥3, #P=0.1, *P<0.05, ***P<0.0005). Representative blots of n≥3 independent experiments are shown.

