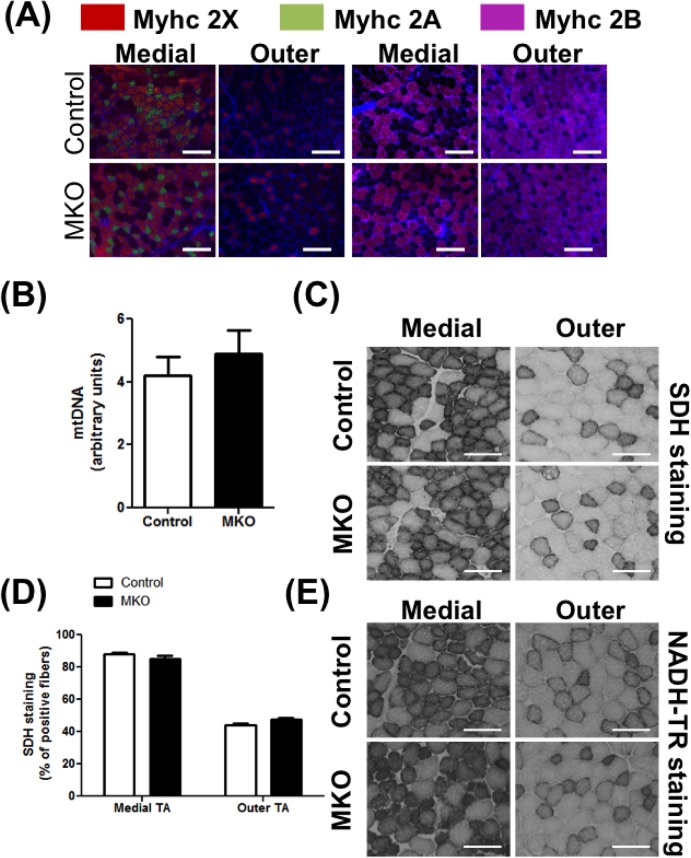
Fig 3. Fiber type and oxidative capacity in NCD-fed mice.
Following parameters were measured in 4 months old control and MKO mice on NCD. (A) Representative images of medial (left) and outer (right) TA cross-sections stained for MyHC IIA (green), IIX (red), and IIB (purple) (N = 4–6). (B) Mitochondrial DNA content in EDL (N = 4–6). (C-D) Succinate dehydrogenase (SDH) staining activity in cross-sections of TA. (C) Representative cross-sectional images of the outer and medial TA (N = 4–6). (D) Percentage of positive fibers quantified in the outer and medial TA cross-sections for the SDH staining (N = 4–6). (E) Representative cross-sectional images of the outer and medial TA with NADH-TR staining (N = 4–6). (Scale bar = 200 μm.) The differences between groups were not statistically significant (Unpaired Student’s t-test).

