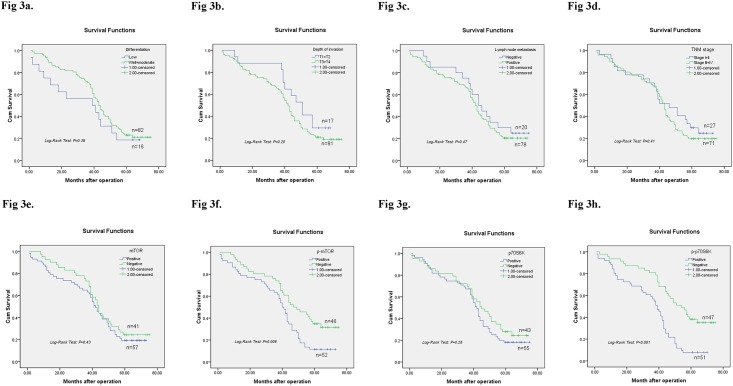
Fig 3. Kaplan-Meier survival curves for overall survival of 98 gastric cancer patients.
Differentiation (3a), depth of invasion (3b), lymph node metastasis (3c), TNM stage (3d), mTOR (3e) and p70S6K (3g) has no relationship with overall survival rate, all P>0.05 analyzed by Log-Rank test. While the most interesting phenomenon is that p-mTOR (3f) and p-p70S6K (3h) overexpression are significantly associated with overall survival rate of GC patients, however, mTOR has no relationship with overall survival.

