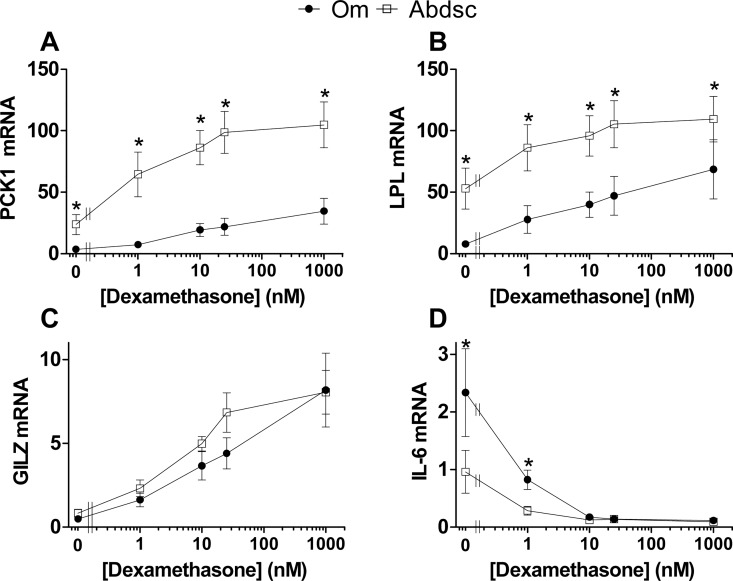
Fig 1. qPCR verification of concentration- and depot-dependent effects of glucocorticoids on selected, known glucocorticoid target genes.
(A) PCK1, (B) LPL, (C) GILZ, and (D) IL-6. Data are mean ± SEM, n = 5–7 independent subjects. The X-axis is a log scale. Significant depot differences at each [Dex] are indicated by an asterisk (*, p < 0.05, paired t-test of log transformed values). Repeated measures ANOVA verified a significant Dex effect in both depots for each gene (Dex effect, p ≤ 0.002). All doses in both Om and Abdsc were significantly different from 0 nM Dex (p ≤ 0.05, Dunnett’s test).

