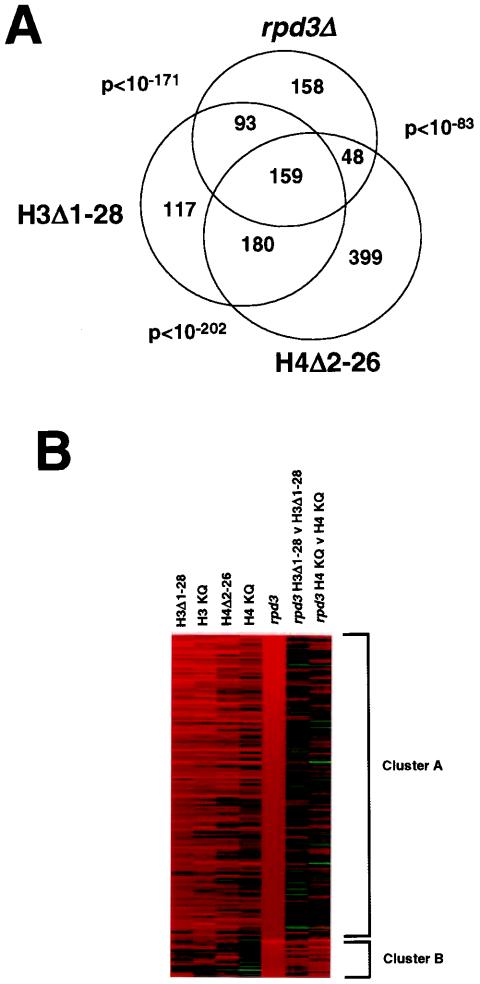
FIG. 3.
(A) Overlap among genes up-regulated twofold or more in rpd3Δ, H3Δ1-28, and H4Δ2-26 yeast cells. Only genes having altered expression values in rpd3Δ yeast cells with Benjamini-Hochberg-derived P values of <0.05 were considered. P values for the significance of overlap between pairwise-considered data sets were based on a hypergeometric distribution. (B) K-means cluster analysis (14) of the 209 genes showing at least a twofold increase in expression (P < 0.05) in rpd3Δ versus (v) wild-type yeast cells. Red represents increased gene expression and green represents decreased gene expression, with intensity being proportional to the magnitude of the change and the range of expression being from fourfold up to fourfold down (i.e., changes of greater than fourfold up or fourfold down are shown at maximal intensity).

