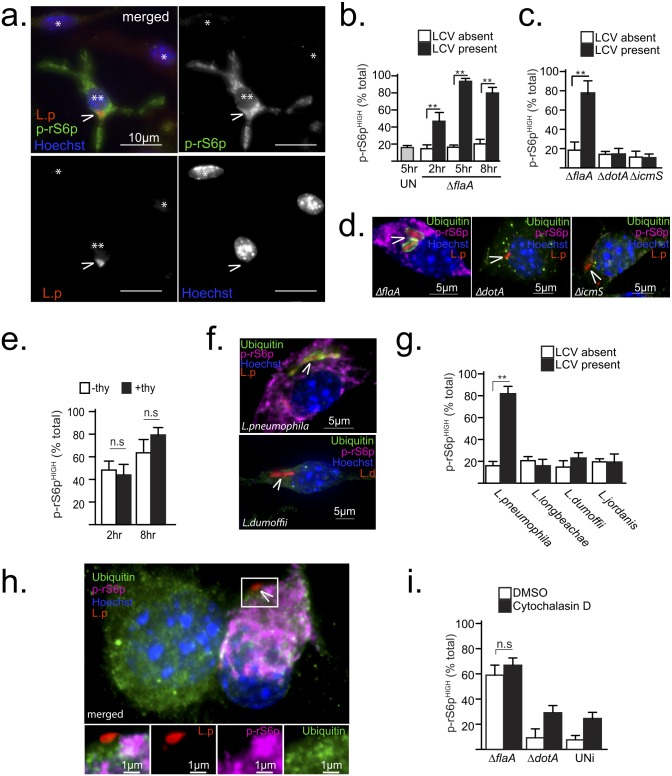
Fig 3. Legionella-induced MTOR activation is a Dot/Icm effector-driven process independent of intracellular niche biogenesis.
(a-h) Show results from synchronized infections (MOI = 20) under serum-free conditions of serum-starved Myd88-/- BMMs treated as indicated. (a) Immonofluorescent micrograph of ΔflaA-infected (**) or neighboring uninfected (*) cells at 6 hrs post-infection stained with anti-L. pneumophila (L.p), anti-p-rS6p (S235/236) antibodies and Hoechst 33342. Arrowheads indicate Legionella-containing vacuoles, Bar = 10μm. (b-c and g) Single cell immunofluorescence analysis of phospho-rS6 positive (MFI>300) BMMs exposed to various Legionella strains for the indicated times (b) or for 8hrs (c and g). Means ± s.d of technical triplicates for the two distinct groups within the cell population—infected (LCV present) and uninfected (LCV absent) for each condition are shown. (d) Micrographs of cells infected with the indicated strains for 8hrs and stained with anti-L. pneumophila (L.p), anti-p-rS6p (S235/236), anti-ubiquitinated proteins (FK2) antibodies and Hoechst 33342. Arrowheads indicate intracellular bacteria, Bar = 5μm. (e) Quantitation of p-rS6p positive cells (MFI>300) in synchronized infections with a thyA ΔflaA strain in the presence (+thy) or absence (-thy) of thymidine for the indicated time periods. Means ± s.d of technical triplicates are shown. (f-g) Synchronized macrophages infections with different Legionella species are shown. (f) Representative micrographs of cells infected with L. pneumophila or L. dumoffii for 8hrs (MOI = 20) and stained as in (d), which are quantitated in (g). (h-i) Cells were treated with cytochalasin D (5μM) or vehicle (DMSO) for 15 min prior to and for the duration of infections (3hrs) with the indicated bacterial strains. (i) Quantitation of p-rS6p positive cells (MFI>300) in contact with bacteria (ΔflaA and ΔdotA) or uninfected cells (UNi). Means ± s.d of technical triplicates are shown. (h) Representative micrograph of macrophages treated with cytochalasin D (5μM) and infected with ΔflaA and stained as in (d). Arrowhead indicates a bacterium in contact with the macrophage, Bar = 1μm. At least 50 cells (i) or 100 cells (b, c, e and g) were analyzed for each condition. A representative of two (f-h) or three (a-g) biological replicates is shown for each experiment. (b, c, e, g and i) n.s—not significant, ** p<0.005 (unpaired T-test).

