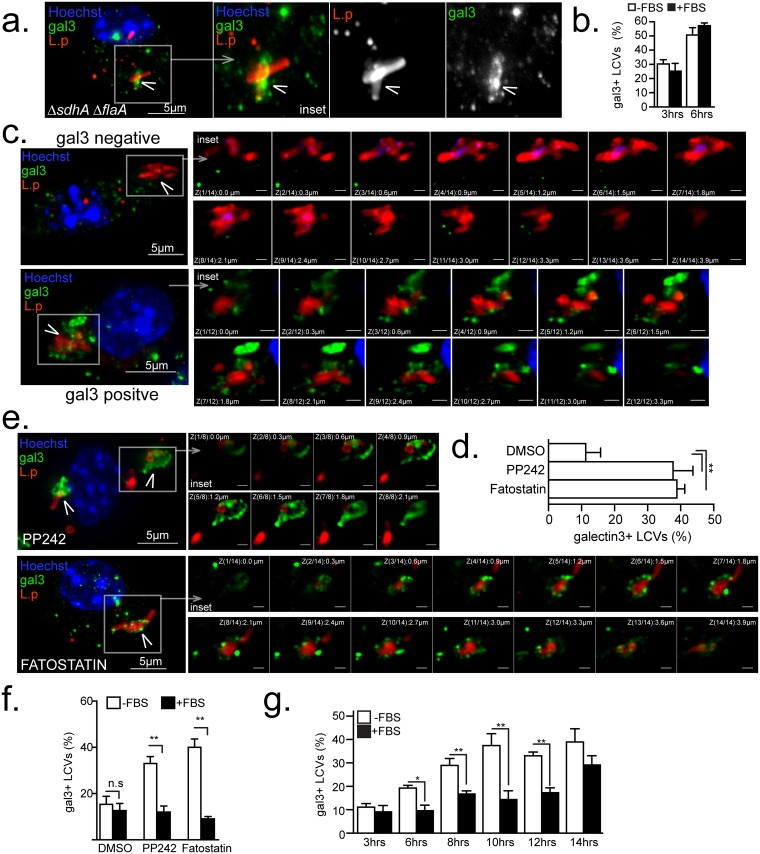
Fig 7. Serum lipids, SREPB1/2 and MTOR regulate LCV stability.
Serum-starved Myd88-/- (a-f) or C57BL/6 (g) BMMs or were infected by the indicated strains (MOI = 20) in synchronized infections for 12 hrs (a-f) or for the indicated time periods (g) in the absence (a-g) or presence (f-g) of FBS. (a-b) Galectin 3 accumulation onto LCVs harboring ΔsdhA ΔflaA. (a) projection micrograph of a representative infected cell with the inset showing the LCV (b) Kinetic analysis of Galectin 3+ LCVs harboring ΔsdhA ΔflaA. (c,e) Representative projection micrographs of Galectin 3 positive (c,e) or negative (c) LCVs harboring ΔflaA after treatments with inhibitors (e) or vehicle alone (c). The insets show all individual planes of the projection image. Quantitation of Galectin 3+ LCVs after the indicated treatments in the absence (d and f) or presence (f) of FBS. (g) Kinetics of emergence of Galectin 3 positive LCV under serum starvation or replete conditions. (c-g) PP242 (2.5μM), fatostatin (4μM), FBS (10%). (b,d,f and g) Means ± s.d of technical triplicates for each condition are shown. At least 100 LCVs were analyzed for each condition. A representative of two (b, f-g) or three (a, c-e) biological replicates is shown for each experiment. (b, d, f and g) n.s—not significant, ** p<0.005 (unpaired T-test) (a, c and e) Cells were stained with anti-galectin3, anti-Legionella antibodies and Hoechst 33342. Arrowheads indicate the LCVs. Bar = 5μm.

