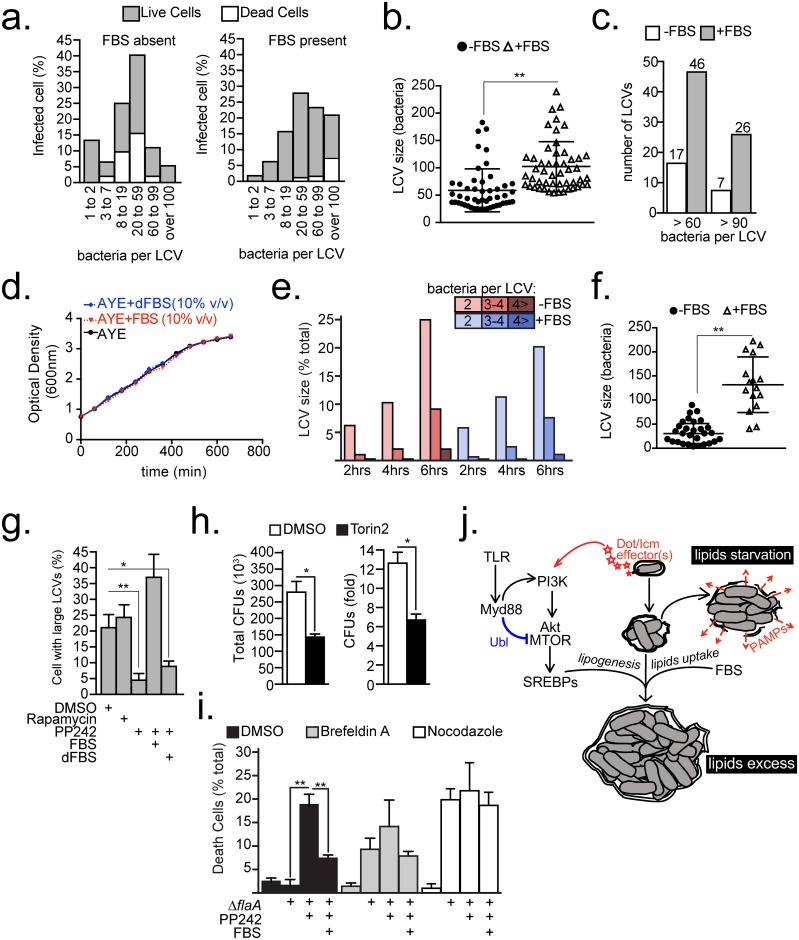
Fig 8. Host lipids dictate the LCV housing capacity.
(a-c, f) Size analysis of LCVs harbored by C57BL/6 BMMs infected with ΔflaA bacteria (MOI = 20) for 15 hrs after 60 min synchronization. Cells were serum-starved prior to infection for 10hrs. LCV sizes were measured through 3D microscopy analysis of infected cells as detailed in S8 Fig. (a) Relative distributions of sizes of LCV harbored by live and dead cells produced by infections in the presence/absence of FBS. Live/dead distinction was determined morphologically by nuclear condensation. (b-c) Size analysis of the 50 largest LCVs produced by ΔflaA infections shown in (a). (d) Legionella growth in axenic cultures supplemented with FBS or delipidated FBS (dFBS) (10% v/v). (e) Kinetic analysis of LCVs that support bacterial replication in C57BL/6 BMMs infected with ΔflaA bacteria. FBS was added or omitted after the infection synchronization at 30min post infection. At least 200 LCVs were scored for each condition. (f) Size analysis of LCVs harbored by cells with condensed nucleus from (a). (g) Percentage of Myd88-/- BMMs harboring large LCVs (bacteria>20) produced by 12 hrs synchronized infections with ΔflaA bacteria. Cell treatments were initiated at 4 hrs post infection as indicated. (h) L. pneumophila intracellular growth in Acanthamoeba castellanii over 48hrs in the presence of DMSO or Torin2 (300 nM), MOI = 5. (i) Percentage of Myd88-/- BMMs with condensed nuclei uninfected or infected with ΔflaA bacteria for 9hrs. Infections were synchronized at 60min and various treatments were added at 6hrs as indicated. (j) Model for MTOR-dependent regulation of LCV homeostasis through the lipogenesis and serum-derived lipids. Abbreviations: ubiquitin ligase (UBL), pathogen-associated molecular patterns (PAMPs) (b, f-g, h-i) Means ± s.d of technical triplicates for each condition are shown. (a and g) At least 100 LCVs were analyzed for each condition. A representative of two (d, h-i) or three (a-c, e-g) biological replicates is shown for each experiment. (a, g and h) PP242 (2.5 μM), Brefeldin A (17.8 μM), Nocodazole (20 μM), FBS (10% v/v), dFBS (10% v/v) (b, f-i) * p<0.05, ** p<0.005 (unpaired T-test).

