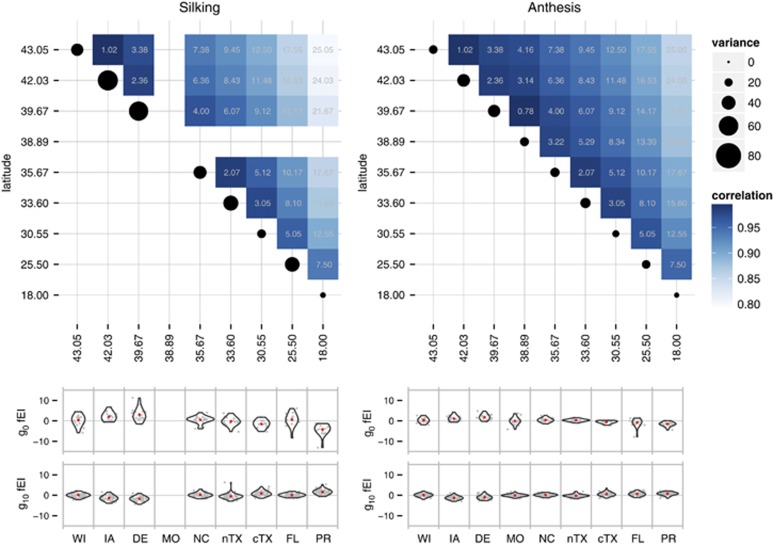
Figure 4.
Family-by-environment interaction variation in flowering time. (a) Tile plots are based on a heterogeneous exponential variance-covariance structure (EXPH VCOV) modeled on the fEI effects (see Materials and methods) with the base correlation estimated as 0.9912 for DTS and 0.9938 for DTA and the exponents (gray text within each tile) calculated as pairwise latitudinal distances. (b) Violin plots showing the density of fEI effects estimated from the family model with an IDV VCOV structure for fEI and subsequently partitioned by generation and environment. Gray points show the fEI effects jittered in the x-direction and red dots show the mean of each distribution. One estimated effect from a family in g0 (fEI estimate: 23.14) was beyond the y-axis scale and is not shown (see Supplementary Figure S3).

