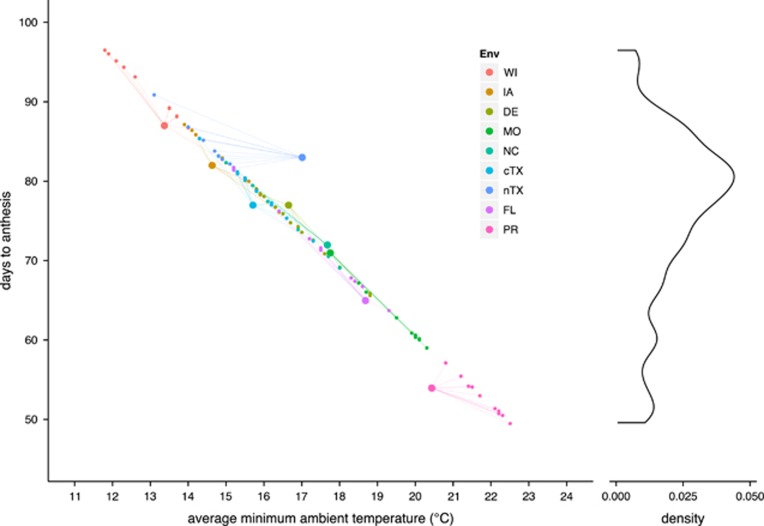
Figure 5.
Decadal minimum ambient temperature-associated plasticity in flowering time. The plot to the left shows the observed and predicted relationship between DTA and the average of the minimum ambient temperature. Using the prediction equation  estimated from linear regression of our observed data (large points) on SATn, DTA was predicted (small points) for each environment, using the average minimum ambient temperature
  in each year from 2001 to 2011 (averages were calculated based on the environment-specific planting and anthesis dates of our observed data and did not include soil temperature). We acknowledge that some of the prediction is outside the range of the observed data and may be unreliable. The plot to the right shows the marginal density distribution of the predicted DTA values.

