Table 3. Correlated responses to 10 generations of selection for earlier flowering in Tusón, genotypic correlation and heritabilities of unselected traits.
| Trait | ORa | ρORb | Ĥplot2 | σ̂P | DTS(Ĥplot2 : 0.47±0.02) |
DTA(Ĥplot2 : 0.53±0.02) |
||||
|---|---|---|---|---|---|---|---|---|---|---|
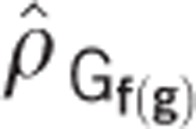
| ρ̂Gf(g) | CR | ρ̂OR-CRc | ρ̂Gf(g) | CR | ρ̂OR-CR | |||||
| ASI | −0.47±0.05 | *** | 0.26±0.02 | 2.2 | 0.56±0.05 | −0.94 | NS | 0.11±0.07 | −0.19 | * |
| PLH | −6.11±0.64 | *** | 0.47±0.02 | 18.5 | 0.37±0.06 | −6.93 | NS | 0.34±0.06 | −6.70 | NS |
| ERH | −6.38±0.65 | *** | 0.44±0.02 | 16.3 | 0.41±0.06 | −6.54 | NS | 0.43±0.05 | −7.29 | NS |
| PEH | — | NS | 0.39±0.02 | 13.4 | 0.03±0.07 | — | — | −0.05±0.06 | — | — |
| TSW | −0.17±0.02 | *** | 0.44±0.03 | 1.0 | 0.48±0.06 | −0.49 | NS | 0.37±0.06 | −0.40 | NS |
| SPL | — | NS | 0.44±0.03 | 30.2 | 0.01±0.07 | — | — | −0.00±0.07 | — | — |
Abbreviations: ASI, anthesis-silking interval; ERH, ear height; NS, not significant; PEH, plant height above ear; PLH, plant height; REML, restricted maximum likelihood; SPL, spike length; TSW, tassel weight; *0.1<P<0.01; ***0.001<P<0.0001.
OR: observed response to selection;  : phenotypic s.d.;
  : restricted maximum likelihood estimated genotypic correlation; CR: correlated response to selection.
P-value based on Wald test; HO: γ>0.
P-value based on t-test with 1 degree of freedom and s.d. equal to that of OR; HO:OR >PR.
