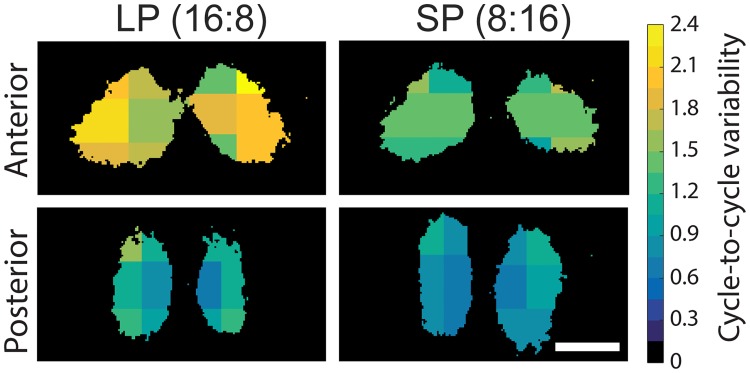
Fig 4. Single-cell period variability (SD) shows regional differences, especially after exposure to long photoperiod.
Regional averages of single-cell period variability binned from all recordings for six areas of the anterior (top panels) and posterior SCN (bottom panels), in long (LP, left panels) and short photoperiod (SP, right panels). As indicated by the color bar on the right, dark (blue-black) colors indicate small, and light (green-yellow) colors indicate larger period variability. Scale bar: 200 μm.

