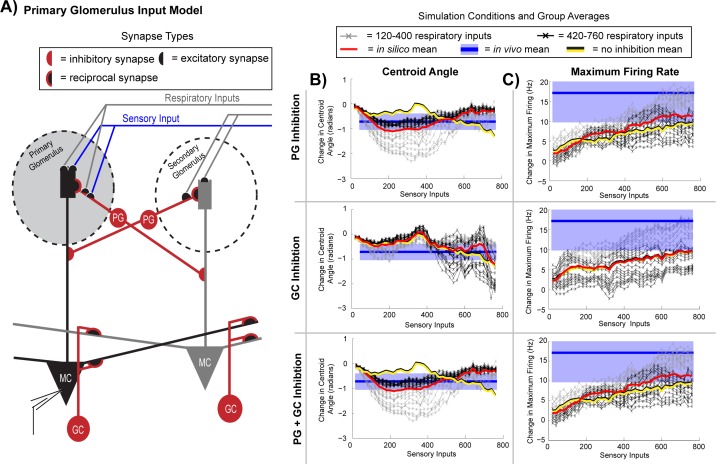
Fig 7. Periglomerular inhibition driven by respiration gates mitral cell activity across the respiratory cycle.
(A) In our circuit model, one mitral cell (black) receives excitatory sensory inputs (blue line) at its glomerulus (large grey circle). Inputs driven by respiration (grey lines, entering two separate glomeruli) have excitatory synapses on the apical tuft of two separate mitral cells. (B) Changes in the centroid angle comparing sensory evoked and respiratory mitral cell activity were examined across varying levels of sensory (x-axis) and respiratory input (lines); results are from simulations that contained only periglomerular neurons (upper row), only granule cells (middle row), and both granule and periglomerular neurons (bottom row). (C) Comparisons of maximum firing rates across simulations types, as in (B). Color key depicting the strength of the respiratory inputs (120–760 synaptic inputs): thick red line = average activity across varying respiratory input strengths (120–760 synaptic inputs), black/yellow line = average activity without lateral inhibition, blue line = the in vivo mean and blue shaded region in vivo mean ± standard error of the mean (SE) recorded across 10 neurons).

