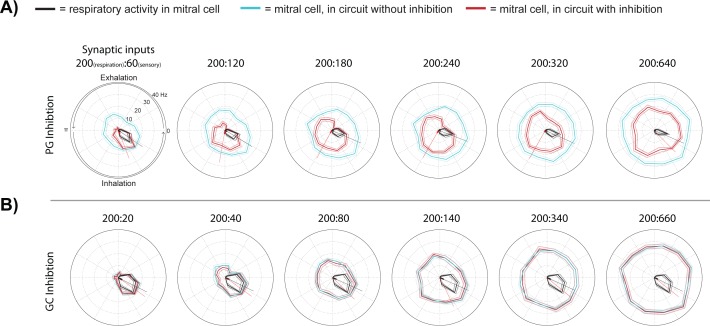
Fig 8. Gating of evoked responses in mitral cell activity is influenced by the ratio of simulated sensory to respiratory input strengths.
Polar plots of stimulated (red, pink: ±SE), control (black, grey: ±SE) sensory input conditions, and a positive control with sensory and respiratory inputs in the absence lateral inhibition (blue, light blue: ±SD). Respiratory inputs for each plot are set to 200 and stimulation inputs are varied from 60 to 640, as shown in the ratio above each plot (respiratory input: stimulus input). Radii (y-axis) scale and respiratory cycle angles (radians) shown in the upper left polar plot is the same for all polar plots. (A) Simulations containing only PG inhibition present and (B) simulation containing only granule cell inhibition. *: P < 0.05.

