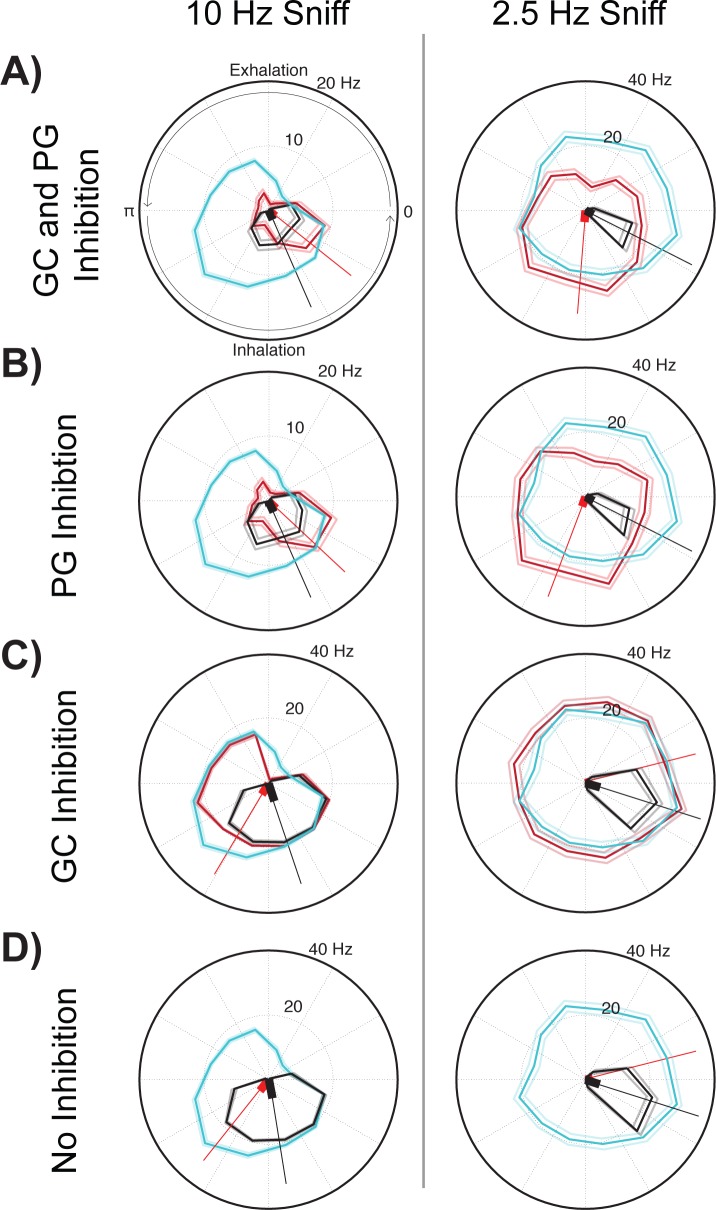
Fig 9. At increased sniff rates, granule and periglomerular inhibition temporally shift mitral cell activity across the respiratory cycle.
A comparison of polar plots of mitral cell activity with sensory input (red, pink: ±SD), control without sensory input (black, grey: ±SD), and positive control with the same input in the absence of lateral inhibition (blue, light blue: ±SD). The circuit connectivity diagram used in this simulation is shown in Fig 7A. Both the respiratory and sensory input strengths were set to 300 excitatory synaptic events for all simulations in this figure. (A) Polar plots of data from the simulation with both periglomerular (PG) and granule cell (GC) inhibition present at a respiratory cycle rate of 10 Hz (left plot) and 2.5 Hz (right plot). Other figures are as (A), except in (B) only PG inhibition, in (C) only GC inhibition and in (D) no inhibition was present in the circuit model.

