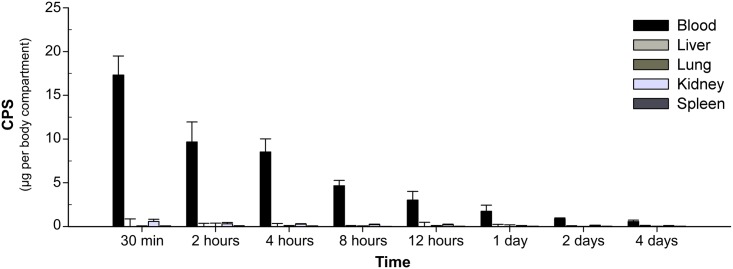
Fig 3. Organ distribution of CPS.
Mice were intravenously injected with 100 μg CPS per mouse. Internal organs (lungs, liver, spleen, and kidneys) were collected at various time points post-injection. The organs were homogenized in PBS. CPS amount per organ was determined by quantitative sandwich ELISA. The amount of CPS in blood samples was calculated from the CPS concentration in serum as shown in Fig 1. Data shown are mean ± standard deviation for five mice per time point. The negative values after subtraction of CPS amounts from serum found in each organ were adjusted to zero. The results showed that no significant amount of CPS accumulated in any of the colletced organs.

