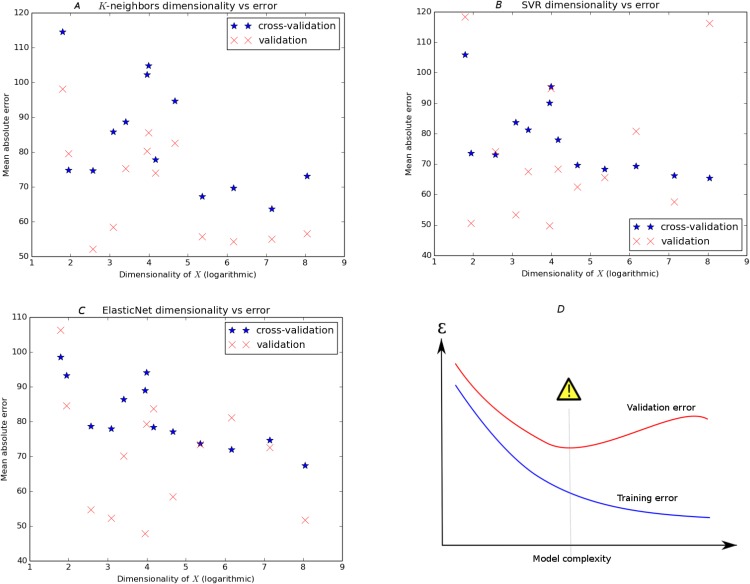
Fig 4. Panel D displays the classic diagram for the bias-variance tradeoff, showing how overly complex models minimize training error but may have sub-optimal test error.
The other panels show a similar picture for three regressors (SVR, KNeighbors, and ElasticNet) with the dimensionality of the dataset serving as a proxy for model complexity. The horizontal dimension is logarithmic.

