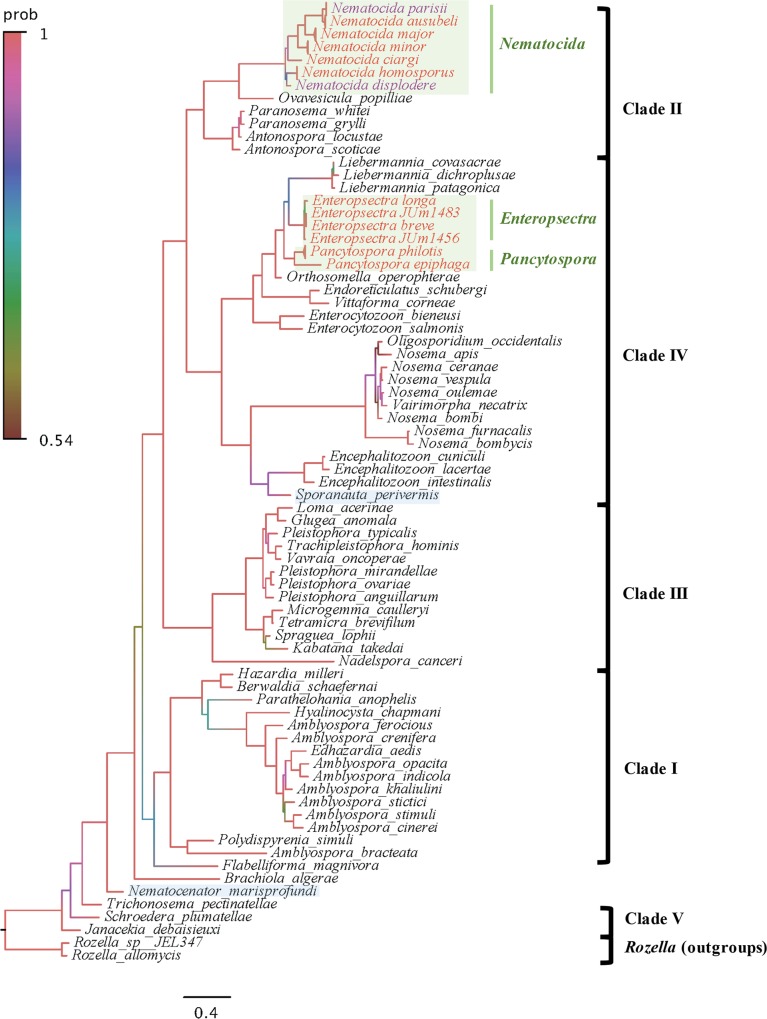
Fig 2. Bayesian inference SSU rDNA phylogeny of microsporidia species.
SSU rDNA sequences from 45 nematode-infecting microsporidia species and 60 other microsporidia species in the databases were used. The tree was generated using MrBayes v3.2.2 and refined by FigTree v1.4.2. Model Kimura 2-Parameter (K2P) was applied. Branch colors show the posterior probability, with the corresponding color code shown on the left. The light green boxes designate microsporidia infecting terrestrial nematodes and light-blue rectangles designate those infecting marine nematodes. Scale bar indicates expected changes per site. Branches of species with more than one strain were compressed.

