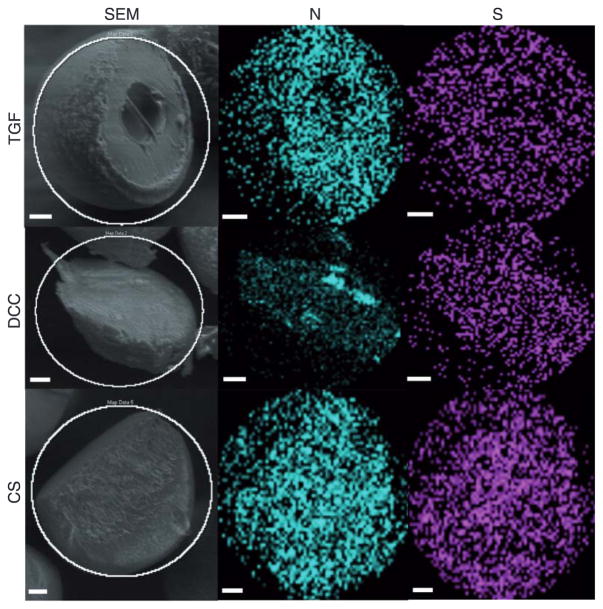
Figure 2.
Scanning electron micrographs (left column) and energy dispersive spectral maps (center and right columns) of cryo-fractured microspheres for atomic nitrogen (N) and sulfur (S). TGF (PLGA with TGF-β3 encapsulated), DCC (PLGA with 30 wt% DCC), and CS (PLGA with 30 wt% CS) microspheres. Note the uniform distribution of nitrogen and sulfur in the TGF, DCC, and CS microspheres. Scale bars: 25 μm.

