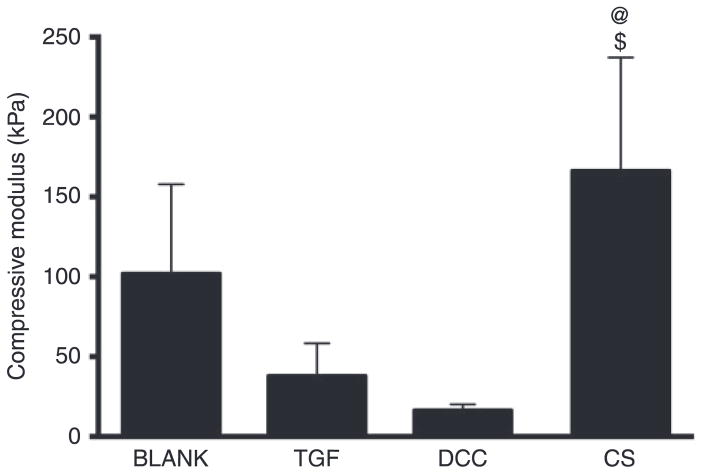
Figure 3.
Average compressive moduli of elasticity of acellular microsphere-based scaffolds at week 0. All values are expressed as the average + standard deviation (n = 6). The CS group had a significantly higher modulus than the TGF and DCC groups. @significant difference from the TGF group and $significant difference from the DCC group (p < 0.05).

