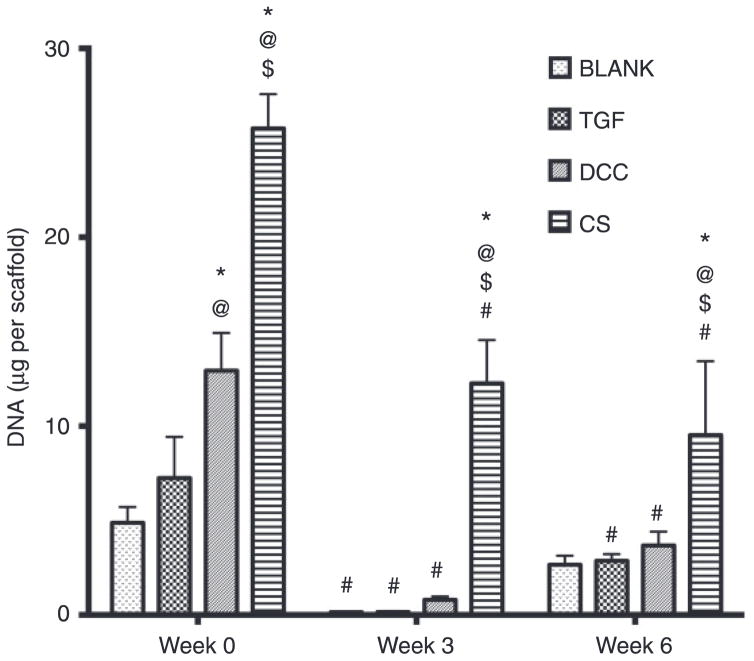
Figure 5.
Total DNA content in different scaffold groups at weeks 0, 3, and 6. All values are expressed as the average + standard deviation (n = 6). The CS group had the highest DNA content at all time points by at least a factor of 2. *Significant difference from the BLANK group at same time point, @significant difference from the TGF group at same time point, $significant difference from the DCC group at same time point, and #significant difference from its value at week 0 (p < 0.05).

