
Fig. 1. CLIP-170 accelerates formin-mediated actin filament elongation.
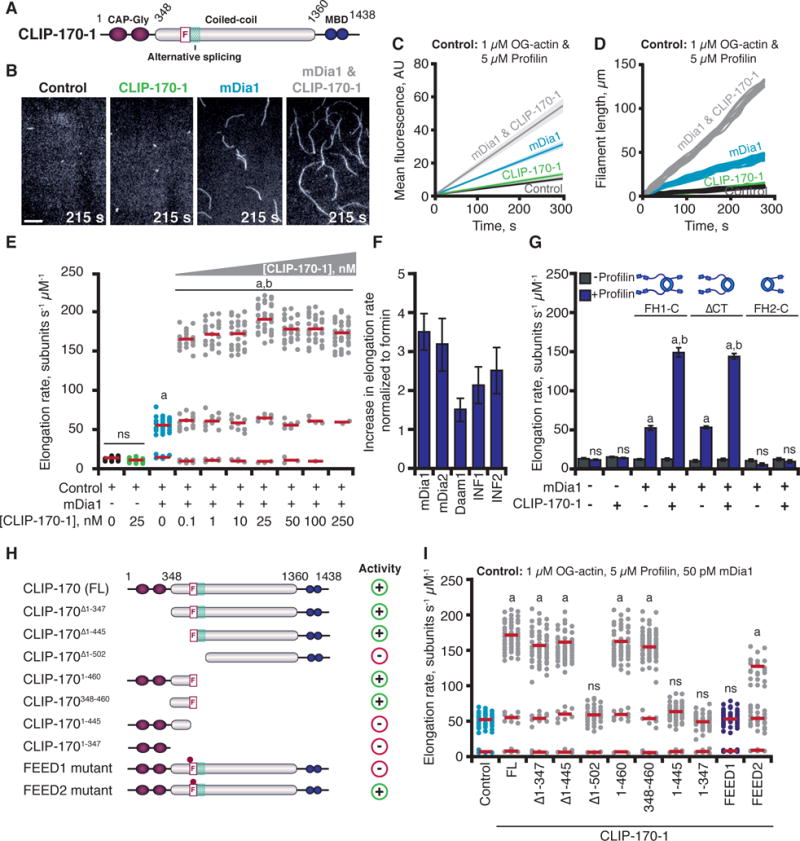
(A) CLIP-170 domains. F, FEED sequence; MBD, metal-binding domain. (B) Images from TIRF assays containing: 50 pM mDia1 and/or 25 nM CLIP-170-1, 215 s after initiation of actin assembly. Scale bar, 20 μm. (C) Kinetics of total actin polymer mass (fluorescence intensity) accumulation averaged from multiple fields of view (n ≥ 3). Linear fits plotted with 95% confidence intervals shaded. (D) Representative filament length traces (10 per condition) from TIRF movies. (E) Distributions of elongation rates from TIRF reactions as in (B) for different concentrations of CLIP-170-1. Distributions are shown from one of three independent experiments (n = 50 each). Red bars show mean elongation rates for subpopulations, measured from all filaments in three separate experiments (n = 150). (F) Fold increase in mean formin-mediated elongation rate stimulated by 25 nM CLIP-170-1. Error bars, SE. (G) Mean elongation rates from TIRF reactions containing different mDia1 constructs +/− profilin. (H) CLIP-170-1 constructs that enhance (+) or fail to enhance (−) the rate of mDia1-mediated elongation. FL, full-length; F, FEED sequence; teal box, alternatively spliced region, dots; FEED1 (445VEEE/AAAA448), FEED2 (450ITKGDLE/AAAAAAA456) mutants. (I) Distributions of elongation rates measured as in (E) for different CLIP-170-1 constructs. Reactions contain 1 μM G-actin (10% OG-labeled; 0.2% biotin-actin), ± 5 μM profilin, ± 50 pM mDia1, 50 pM mDia2, 50 pM Daam1, 100 nM INF1, or 100 nM INF2, ± 25 nM full-length CLIP-170-1 (wild type, FEED1 mutant, or FEED2 mutant). Statistical differences in (E, G, & I): ns, not significantly different from control; a, compared to control (actin and profilin) (p < 0.05); b, compared to formin control (actin, profilin, and formin) (p < 0.05).