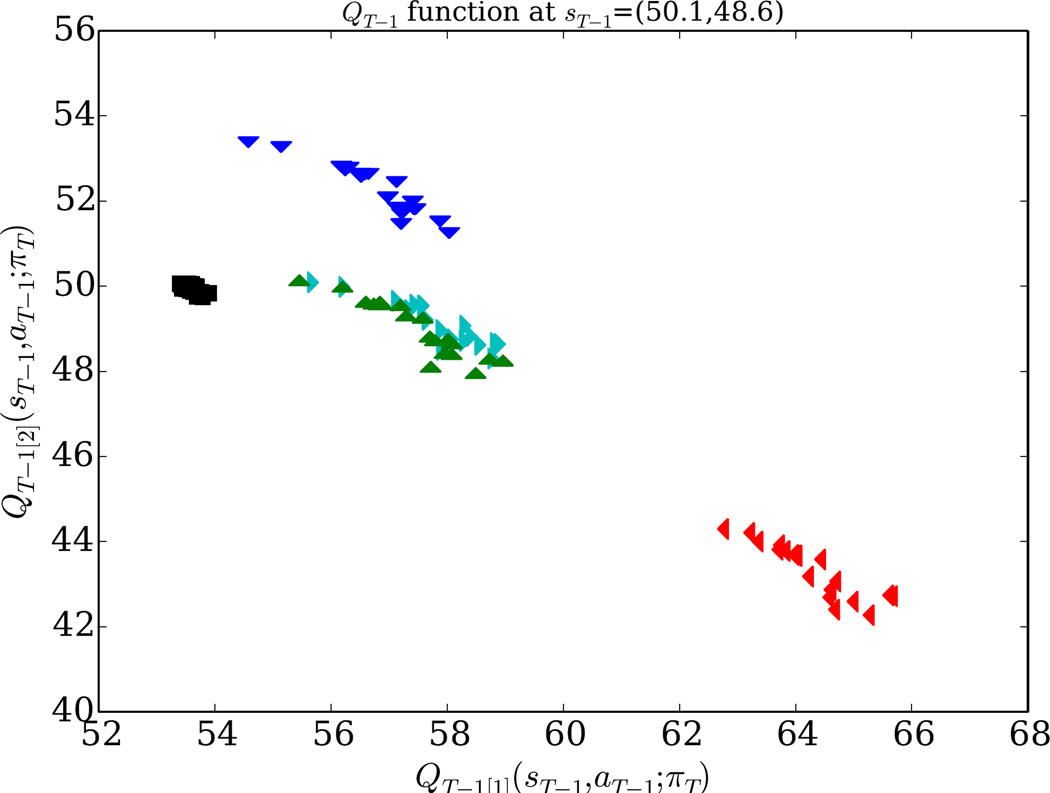
Figure 2.
Partial visualization of the members of an example 𝒬T−1. We fix a state sT−1 = (50.1, 48.6) in this example, and we plot Q̂T−1(sT, aT) for each Q̂T−1 ∈ 𝒬T−1 and for each aT−1 ∈ { ,
,  ,
,  ,
,  ,
,  }. For example, the
  markers near the top of the plot correspond to expected returns for each Q̂ ∈ 𝒬T that is achievable by taking the
  action at the current time point and then following a particular future policy. This example 𝒬T−1 contains 20 Q̂T−1 functions, each assuming a different πT.

