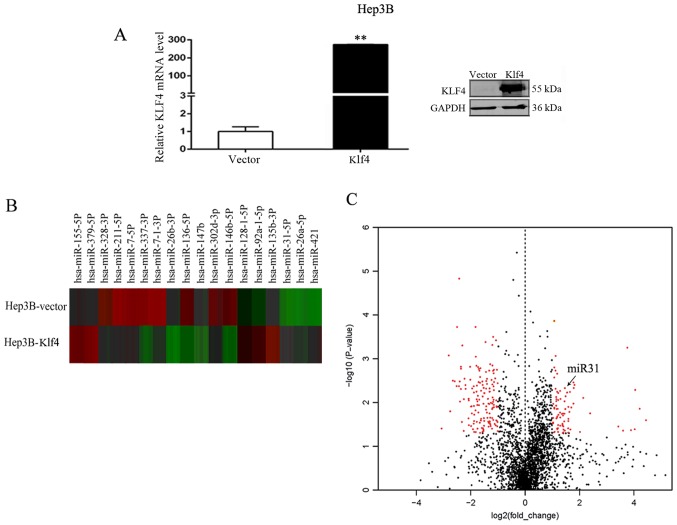
Figure 1.
Differentially expressed miRNAs in Hep3B cells transfected with empty vector (Hep3B-vector) or with Klf4 overexpression vector (Hep3B-Klf4). (A) RT-qPCR and western blot analysis of Klf4 expression in Hep3B cells transfected with Klf4 plasmid. **P<0.01. (B) Heatmap of 18 most differentially regulated miRNAs from the miRNA array of Hep3B cells transfected with empty vector or with Klf4 overexpression vector. There were 8 upregulated and 10 downregulated miRNAs. (C) Volcano plot demonstrating the profile of the differentially expressed miRNAs in Hep3B cells. This plot demonstrates the fold change (x-axis) and significance level expressed as the log10 P-value (y-axis). The red dots on the left represent the downregulated miRNAs in the Hep3B cells transfected with the Klf4 overexpression vector compared with the cells transfected with the empty vector. The red dots on the right represent the upregulated miRNAs in the Hep3B cells transfected with the Klf4 overexpression vector compared with the cells transfected with the empty vector. The black dots indicate miRNAs that did not exhibit a significant change in expression. Significance was determined with a P-value cut-off of 0.05 and a 1.5-fold change.

