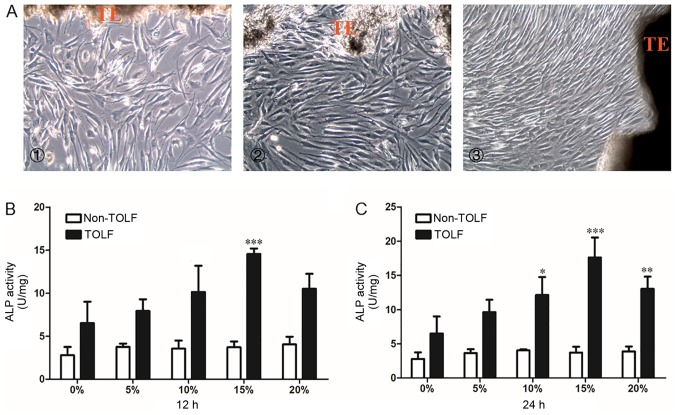
Figure 3.
Morphology of primary ligament cells and quantitative analysis of alkaline phosphatase (ALP) activity in determination of optimal stress level. Morphology of primary ligament cells. (A) Cell morphoology in the cells from patients in the different groups: panel 1, non-TOLF gorup; panel 2, single-level TOLF group; and panel 3, multiple-level TOLF goup (×100 magnification). TE, tissue explant. (B and C) Quantitative analysis of ALP activity in TOLF and non-TOLF groups under different strengths of cyclic mechanical stress (0, 5, 10, 15 and 20%) for (B) 12 h and (C) 24 h (data are the means ± standard deviation; n=3 patients/group). *P<0.05, **P<0.01, ***P<0.001 vs. 0% in each group. TOLF, thoracic ossification of ligament flavum.

