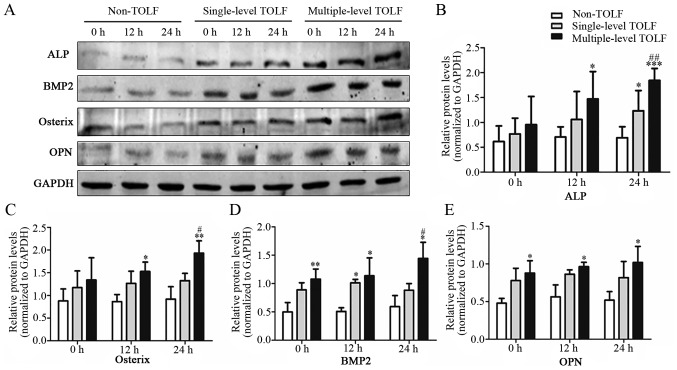
Figure 6.
Osteogenic marker expression at the protein level. (A) Western blot analysis of thoracic ossification of ligament flavum (TOLF) and non-TOLF samples. (B and E) Semi-quantitative analysis of protein expression in non-TOLF and single- and multiple-level TOLF. (B) Alkaline phosphatase (ALP), (C) osterix, (D) bone morphogenetic protein-2 (BMP2), and (E) osteopontin (OPN) (mean ± standard deviation; n=3 patients/group). *P<0.05, **P<0.01, ***P<0.001 vs. non-TOLF at the same time point. #P<0.05, ##P<0.01 vs. single-level TOLF at the same time point.

