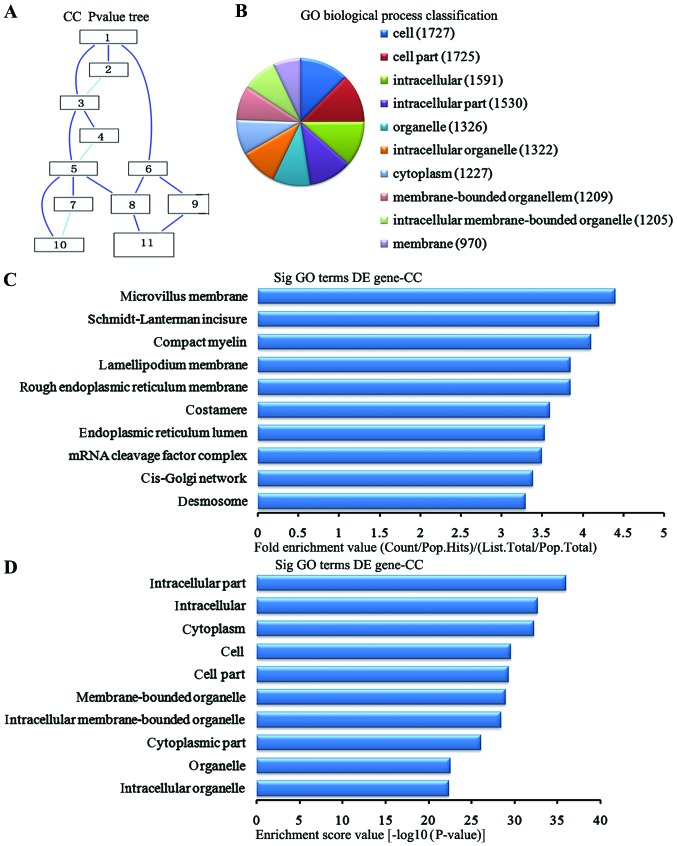
Figure 7.
Analysis of the cell components for the downregulated genes in the bone marrow-derived mesenchymal stem cell (BMSC) transplantation [(BMSC) (t)] group vs. the brain ischemia (BI) group. (A) The cell components P-value tree. (B) Cell components classification according to the number of measured differentially expressed genes. (C) The map of the top 10 cell components according to enrichment factor. (D) The map of the top 10 cell components according to enrichment points. DE, differentially expressed.

