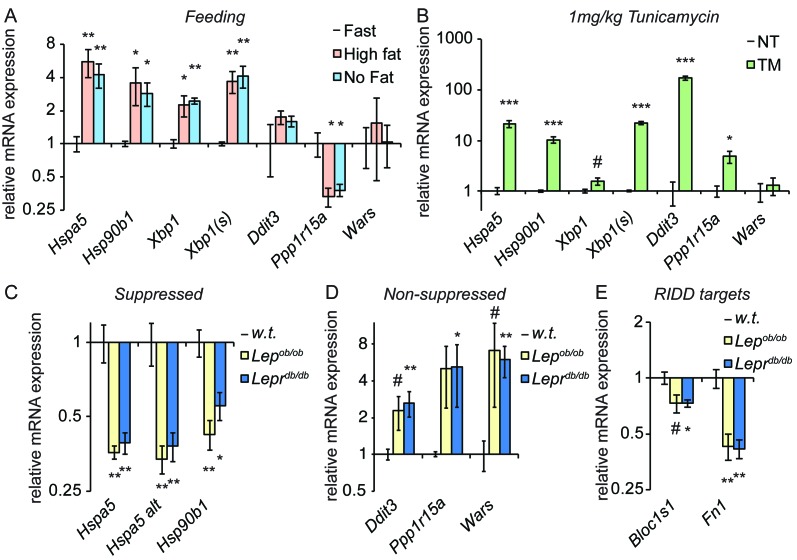
Figure 6. Genetically-induced obesity phenocopies chronic stress.
(A) Wild-type animals were fasted overnight, and then provided food containing either 45% fat or no fat for 4 hr. Expression of the indicated genes was assessed by qRT-PCR. n = 3 animals/group (B) Wild-type animals were treated with 1 mg/kg TM for 4 hr, and the same genes as in (A) were detected by qRT-PCR. #; p<0.1. n = 3 animals/group (C–E) Livers from five month-old female Lepob/ob or Leprdb/db mice or age-matched wild-type mice were probed for expression of genes that were suppressed by chronic stress (C) or not-suppressed (D), or of the RIDD target Bloc1s1 and the putative RIDD target Fn1 (E). n = 4 animals/group.
DOI: http://dx.doi.org/10.7554/eLife.20390.013

