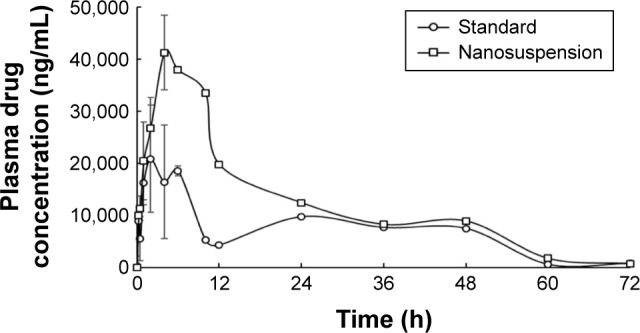
Figure 5.

Plasma concentration–time curves of gefitinib and gefitinib nanosuspension (data presented as mean ± SEM, n=3).
Abbreviation: SEM, standard error of mean.

Plasma concentration–time curves of gefitinib and gefitinib nanosuspension (data presented as mean ± SEM, n=3).
Abbreviation: SEM, standard error of mean.