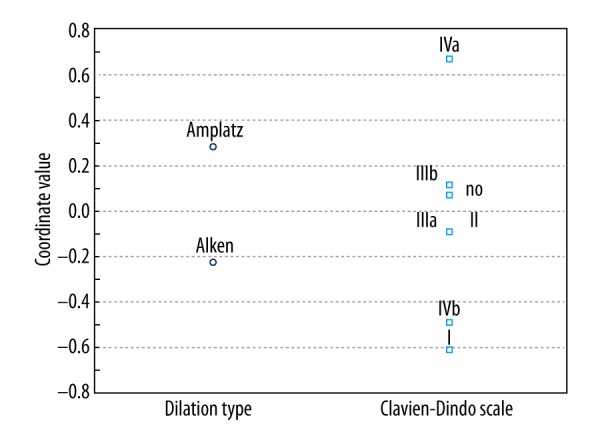
Figure 1.

One dimensional plot of correspondence analysis. Position of squares and circles represent the inertia of variables. The higher coordinate value for Clavien-Dindo grade, the higher likelihood it occurred after Amplatz approach. The lower coordinate value for Clavien-Dindo grade, the higher likelihood it occurred after Alken method.
