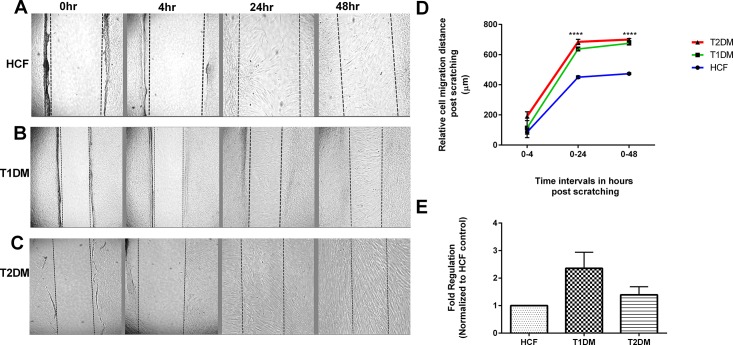
Fig 2. Scratch wound healing and MTT assay.
(A-C) HCF, T1DM and T2DM cells were scratched and the relative cell migration distance was quantified at 0hr, 4hr, 24hr and 48hr time points. (D) Scratch assay quantification showing significant increase in cell migration distance in both T1DM and T2DMs when compared to HCFs. (E) MTT assay quantification for HCF, T1DM, and T2DMs. Data was normalized to HCFs and fold regulation is plotted. One way ANOVA for total n≥3 data sets. (* = p≤0.05; ** = p≤0.01; *** = p≤0.001; **** = p≤0.0001).

